Showing posts with label Climate. Show all posts

August 10, 2022

Weather Engine

Way back when I first started coding up this project (several years ago now), one of the first things I implemented was Alexis' weather generator.

It works pretty well. Working with real-world data as the seed input is easy. I've extended the system a little bit to make it more versatile throughout the year.

The only bits of data I need are: minimum and maximum monthly temperature in Fahrenheit (high and low), and the months in which the high occurs. I also collect high and lows for the precipitation (in mm) and the month in which that high occurs.

"climate": {
	"temperature": {
		"minimum": {
			"high": 77,
			"low": 47,
			"highMonth": 7
		},
		"maximum": {
			"high": 89,
			"low": 62,
			"highMonth": 7
		}
	},
	"precipitation": {
		"high": 126,
		"low": 70,
		"highMonth": 7
	}
}

With these numbers, it's a simple enough matter to fit a sinusoidal curve to give me the monthly average high and low for any given month. Admittedly, very few places on earth have a perfectly balanced summer/winter cycle, but this can be forgiven, and the players are unlikely to notice in any case (particularly across such a relatively small area).

A whole year of temperatures

I've incorporated a few extra bits into my version of the weather engine. The first is apparent temperature. At higher temperatures (80F+), high humidity makes the air seem hotter. This is usually reported as Heat Index. Conversely, when the air is cold, wind can make it feel even colder (Wind Chill).

Next, I used a IDW algorithm (my go-to) to spoof data for all hexes based on just a few inputs. I grabbed a few stations from around the State, but with this method, I don't need to worry about researching all 170+ points.

On one of the original weather posts, Vlad made a comment about how much rain it generates. These are some good thoughts for possible mods. I don't see that problem cropping up at the moment, but it's something I'll keep an eye on.

As another potential update, I could use a Gaussian distribution to generate the temperature for each day, or calculate the daily drift differently. But for now this works well.

August 7, 2020

Koppen and Holdridge

The last step in climate is to apply the Koppen or Holdridge mappings, based on the local temperature and precipitation properties.

I'm not at all convinced that Holdridge is working for me. But I like to keep it around just in case.
Holdridge key
Holdridge
Overall, Koppen seems more intuitively correct.
Koppen key
Koppen
A nice mix of types of terrain. For some reason I feel like Koppen is easier to work with. Maybe it's the palette. Using all this data, I assign a terrain value (such as forest or savanna). This lets me make a map which is more human friendly.

Terrain
There's a lot of savanna here, as it turns out. I can live with that.

I think the next thing I'll dive into is individual resource research. I want to start gaming at some point in the next ten years, so it's necessary to get some actual stuff a party could use (as well as the historical simulation for background). That'll be a project in itself.

June 27, 2020

All Together Now

As I revisit my generation process from top to bottom (as I do every few quarters), it might be helpful to have a flowchart or at least a process list, both for my own reference and the general welfare of the public.
  1. Terrain generation, either from code or manually input (do not recommend)
  2. Derive currents by a) determining major trade currents at 0 and 45 latitudes, b) extending these currents and splitting them where they hit landforms, and c) interpolating these currents via IDW to make a nice smooth surface. I also have found that d) applying a Gaussian smooth filter to the results is even nicer.
  3. Assign sea surface temperature (SST) and measure the effect of the currents on that temperature: currents from the poles bringing cooler water down to the equator and vice versa.
  4. Generate areas of high and low pressure
  5. From the pressure map, obtain wind direction and speeds
  6. Determine the effect of topography on wind
  7. Apply base precipitation and use the on-shore winds to blow that moisture across the continents
  8. Use the coastal current temperatures and on-shore winds to determine areas of coastal climate influence
  9. Apply base temperature, then modify it according to the coastal climates
  10. Lapse the temperature up mountain slopes
  11. Run Koppen and Holdridge algorithms
At this point, social simulation can take over.

January 1, 2019

Desirability III

I am working on making the desirability index more parameterized. With this, I can create sets of parameters for each race, because humans, elves, etc will not desire the same climates, terrain, or biomes for their habitations.

I'll probably be tweaking those recipes for a long time. I haven't looked into details on the races (5e is, of course, deeply unsatisfying). But I'm not worried about that for now.

Most races avoid the rainforest - the soil is often poor for many types of crops. Dwarves like mountains and avoid the coast - but they're not total loners so they'll utilize rivers for travel. Stuff like that.

This is a hard map to read - essentially I've layered five races on top of one another; humans: green, elves: red, dwarfs: blue, halflings: orange, and orcs: purple. Why those five? No idea. I wanted the three classics, plus a feature race for ice and desert climates that would be inhospitable for the others. The orcs end up with a lot of territory, but they are not as gregarious (modeled with an infrastructure penalty), so the size of their empires should theoretically be limited. The elves also have a wide distribution thanks to the large amount of rainforest (unless I penalize them for it also).


All of this is, of course, very modular. It's easy to change the climate models and then propagate those changes to the desirability. This is a far cry from where I was earlier this year, where a map like this would require tons of manual rework.

Creating this Step 0 desirability map is more or less straightforward (tweaking is, as always, necessary). However, existing infrastructure will also affect the terrain...but I haven't built any of that code, so that will need to be next.

November 26, 2018

Wind VI: Wind Pun

Getting the wind model to work is the easy part.

Figuring out what parameters to use is the hard part.

One issue that I ran into last time is the fact that if wind starts going in the same direction from a bunch of sources, simple vector addition can add up fast.

That's because I've been treating my wind collisions as elastic collisions. There are two major kinds: elastic and inelastic. In an elastic collision, no energy is lost to heat, etc. So two (or more) winds enter a hex, one wind leaves. The following formula is used:
\[m_0 v_0 + m_1 v_1 + \cdots + m_n v_n = m_f v_f\]
This is essentially what we've been doing, in two dimensions, treating all masses as equal (even the final mass). Because I'm ignoring masses, this isn't really a physically correct description of an elastic collision.

The other option is inelastic. I think this is better, because we can think of the input winds "sticking" together into a new mass of air. This is not how fluids really mix, however, but it will be good enough. This formula is (ignoring masses again):
\[v_f = {v_0 + v_1 + \cdots + v_n \over n}\]
Which is simply the average.

So let's try a few combos of parameters. \[g\] is the ratio of decrease between each successive push, and \[z\] is the slope change (in feet) at which the wind is deflected by 45 degrees.

g=0.7, z=5000, elastic
g=0.7, z=5000, inelastic
g=0.7, z=2500, inelastic
g=0.8, z=2500, inelastic
g=0.9, z=2500, inelastic
g=0.99, z=2500, inelastic
Overall, the inelastic collision seems much more accurate. I also need to take a look at the downhill slope speed increase, which is not set for these simulations. The wind is still modulating into bands of 60 degrees, even with Gaussian blurring. Scott has trouble with straight bands, I have trouble in an additional dimension!

Also, I need to develop some better representation for topography. The heightmap is huge overkill here, but its difficult to see the effect of altitude when height is not shown at all. Something for a rainy day (of which there are many upcoming).

November 21, 2018

Wind V: Clearer Winds

As often happens, I'll publish an initial post on some subject, then add bells and whistles on to my code, then post the "finished" product with a few quips, and expect the audience to have insight into the chaos of my workflow.

So I've decided to put the wind model down on blog-paper, at least to make it clearer to myself and others. I was inspired by Here Dragons Abound, who also revisited his wind model and arrived at the same method that I did (just with better pictures)! So this post is essentially the same, just with some different words and pictures, for my own reference.

Getting the initial wind values at the coast was the easy part, really. But what to do once I have them?

Ideally, I could use some kind of iterative finite element method to solve for the flow across the surface. But that's pretty complicated and if I can find something simpler, I will.

There are a few things to keep in mind as we create this model.

  • Wind slows as it drags across the ground
  • Wind picks up speed when going downhill and slows uphill
  • Wind is turned aside by mountains
So there are (in the most simple representation) 3 parameters that can be tuned. I'll call them $g$ for ground drag, $s$ for slope change (where $\Delta$ can represent the different in height of the hexes), and $\theta(\rho, \Delta)$ for the change in direction by a mountain (or hill, etc), where $\rho$ is the sensitivity of the wind.

Let's begin with a single wind vector.

The basic method of propagation is along the vector projection of the direction between the two hexes. I refer you to this diagram from the post on tectonics. We are interested in the $d_{\perp f}$ vector.


Projecting the vectors:

One downside of this approach is that eventually, every initial vector gets binned into one of the 6 hex directions, so the wind map becomes much more West Marches-esque, with strictly defined angles in increments of 60 degrees. But let's propagate each of these three resultants.

Next, we add the vectors (simply adding the $x$ and $y$ components) for E and B.

And of course, E and B will project onto D, and so on. But I'll ignore that for now.

So what about mountains, or other obstacles? How much is it affected? Let us assume that A represents a high mountain at 10,000 ft, and that the other hexes are 1 ft. We can then define $\theta$ in terms of $\Delta$ as:
\[\theta = {90 \exp\left(\rho\Delta\right) \over 90 + \left(\exp\left(\rho\Delta\right) - 1\right)}\]

The value $\rho={\ln(89) \over 5000}$ indicates that the wind is turned aside 45$^\circ$ at a slope of 5000 ft. So for our Mountain A, it will be 89$^\circ$. I have no idea what number will work best here. The relative direction of change is to the right in the northern hemisphere, and to the left in the southern hemisphere.

And so it continues (I haven't actually propagated A out fully).

As far as picking up speed goes, I have $s = g$ if $\Delta < 0$ else $1$. But I want to do some tweaking of this anyway (I also see a lot of stuff that I want to update/clean up, just from going through this exercise). I've been using $g = 0.946$ after my initial experiments.

So the final model for the effect of wind from Hex 0 to Hex 1 (where $h_{01}$ represents the vector from 0 to 1):
\[w_{01} = g \cdot s \cdot {w_0 \cdot h_{01} \over |h_{01}|^2} h_{01} + \angle \theta(\rho, \Delta)\]
I guess that looks kinda complicated. If you can't wow them with facts, dazzle them with bullshit.

There is also a choice to be made in the algorithm for propagating vectors. Either we can view this as an expanding frontier, where the next set of hexes to be solved is defined by where the vectors in the current frontier are pointing (projection is only ever positive for 3 hexes at most), or we can fully propagate each vector from each source (which are all coastal hexes) and then average them at the end. Right now I'm using source-propagation since its a little faster, but I'd like to take another look at frontier-propagation.

I'll save the good stuff (the actual application on the map) for another post.

November 6, 2018

Desirability II: Where Do All the People Go?

I've been getting way behind on posting, largely because of my struggles with getting the climates to fall out just right. I know, I know, there's a fair bit of ad hoc going on here. But I've had some trouble in the past with my climates swinging directly from harsh rainforest to harsh deserts. I've got to figure out some methods to smooth that out.

First of all, I can lower the temperature model. It's not just the rain - although that hurts too. Temperature is an odd bird, especially trying to go from this chart on Cartographer's Guild to some actual numbers that I can use for my model. I may need to step back to those isotherms and see if I can build up the coherent model from that. I've been trying several different math functions to try and get smooth interpolation, but I haven't found one that works.

Koppen map
I want to see more green here. The real world has a lot of green (which is the C climate type, really good for crops and such). Some tweaking improved this. However, there's still very little D (boreal), denoted by turquoise. This isn't really a problem, exactly, but I wonder how much of this is due to the terrain/climate system and how much is due to the errors of the model.

However, I can take another look at my "desirability" maps. I still have some tweaking to do to make the right recipe, and then do it again for all the races I want to include! Here is where the climate distribution shows its ugly belly.

The greener, the better
It seems at first glance that there's a lot of empty space. Everyone wants coastline, of course, but no one wants to be in the desert (humans, anyway; I like the idea of desert orcs).

Things to think about:

  • Why did the terrain generator make all my coasts so low? Good coastal access should be a bit rarer - as it is, 98% of coastal hexes are lower than 500 ft.
  • How do different climates affect desirability rating? How about resource availability (which system will take years to fully develop, of course)? How about other cities and their cross-country roads?
  • How should I start placing cities on here once I like the maps? Of course, I can start work on that model right away, since it's all generated, and refine them in tandem.

October 8, 2018

Koppen with Smoothing

I kinda like this. I've also tweaked the temperature distribution a bit.


October 5, 2018

More Koppen

Testing out the new wind algorithm. With a perfectly flat world, we get the following Koppen distribution.


It's interesting that Af (tropical forest) butts right up against Cfa (temperate). This has to do with the heavy rain sweeping across the Af areas - on the border with Cfa, the temperature drops (and changes the category) but the precipitation does not change in kind. This leads to an odd boundary, but it's not unheard of in the wild. I'd just like to see a few more A categories, so I need to tweak the amount of precipitation.

I also am considering the mode smoothing discussed here. I think that might help the artistic effect at least.

September 26, 2018

Wind IV: Rain I: Water is Wet

So I've gotten the wind working more or less how I want. Now I need to push water (in the form of rain) across the landscape.

The initial inputs are observed from the current influences. Cold currents are dry, mild currents are half-wet, and warm currents are the wettest. These begin at the coasts. Then, based on the wind map, the rain moves across the landscape. It drops more water (and exhausts itself faster) when a positive slope is encountered.

Some of the code isn't working exactly like I want it. There are too many straight lines here, but overall I'm able to avoid a lot of ad hoc, and in the end, that's on the right track.

July
January

The wind is altered both by the existing terrain and by the natural winds which are the sole product of the pressure zones. These are the default where nothing else exists. Eventually, though, the air runs out of moisture, leading to the large arid areas in the center of the larger continents.

September 19, 2018

Wind III: Swirls

I needed to redo the wind algorithm, but I want to avoid solving the Reynolds equation over the surface, because that's dangerously close to my real-world research.

So instead of pushing it along hex vector directions, I propagate each wind cell to every neighbor, and then add the vectors in inelastic collisions.

This puts me on the right track, but there's still something missing. For one, the code is ignorant of the hexmap layout, and so it's unaware that there are 60 degree turns at the folds, and the equator is also a problem (notice the big black splotch below). However, I'm getting much more simulated flow this time, and so I think I'm close.

I'm also using a box blur here on the values to make them smoother. If you do this a few times, it approximates a Gaussian blur, so that's easy to do. I'm not sure if I'll stick with this for the final iteration or just use it for display.


Another interesting effect is that the wind dies out going up a mountain slope, but increases to gale-like proportions on the other side. Hm. Some experimentation will be necessary but I can tweak that after I fix the actual propagation.

September 10, 2018

Temperature III: Generating Temperature

Now I'm really on a kick. I want to move away from manually drawing anything I can, so I can focus my creative efforts to the greatest effect. Temperature will be a fun one to work on.

The baseline proved tricky to try and match to Earth values, So I made my own:


\[ T = \frac{T_{max} - T_{min}}{2} \cos\left(2 \frac{\pi}{180^\circ} \ell \right) + \frac{T_{max} + T_{min}}{2} \], where $T_{max}=90$, $T_{min}=1$ if the latitude $\ell$ is below the equator ($\ell < 0$) and $T_{min}=41$ otherwise.

The equator stays roughly the same, but the baseline will shift back and forth between January (blue) and July (red).

January

This color scale is a bit misleading, I think. But it does show the general plan.

September 3, 2018

Current Influences

A big part of Azelor's Guide is the effect that currents have on temperatures. Generally speaking, if a warm current is near a coastline, the climate there will be warmer than it might otherwise be (Spain, for example). So this is pretty necessary for any kind of complex climate.

This should be easy (famous last words) because I already have the wind maps and the current maps. So theoretically, I just work inwards from the coasts, scaling the "degree" of influence to the wind speed. I'm not sure yet how I want to map the influence to the temperature, but that will come later.

Green - mild, blue - cold, red - hot, yellow - continental, dark yellow - continental plus

One thing I do notices is that I think the continental influence should be closer to the coast. I think I should also explore the wind model to see if I can push those winds a bit further inland. Right now, they are breaking against the elevation change, so I probably need to reduce the wind loss as it moves uphill.

First, though, I'll see how the model works when I run it on non-dummy data.

August 31, 2018

Winds II: Better Winds

Inverse distance weighting is working well. So I decided to apply it to the sea winds as well. It gives nice smooth interpolation, even if there are some places that are a bit odd. But that's ok. Nothing is perfect...yet.


Once both season (hot and cold) have been calculated, I can use the areas near the coast to define the boundary conditions for the existing land wind model. For the coastal currents only, I've categorized them as cold, hot, or mild. These aren't absolute values, just relative ones. This feeds into the precipitation model, which will be used to give better results for erosion. I'm waiting to put the finishing touches on the erosion model until I can staple these parts to it.
August 29, 2018

Currents III: Better Currents

How did I not used Inverse Distance Weighting before now? It's easy to implement, and looks much more natural. Before, the currents looked a lot like Voroni diagrams in some places...sometimes they looked good, but mostly they just were offsets from the coast. It does take a while to run for now, because I haven't optimized the function like I think I can.


All in all, it looks pretty smooth. I guess I could use some kind of finite element modelling to get a really good simulation, but that's too much work for the benefit. I'd have to know a lot more about the ocean floor topography, which is something I haven't even touched.

August 10, 2018

Currents II: Getting Tide of This

I'm so, so, sorry about the pun.

That being said, the current-code is coming along. Eventually, as usual, I found a way to cheat. The only time a current should cross the ocean (at least in the initial pass) is when it's being blown by a very powerful wind, which happens around the Equator and 45$^\circ$. Outside of that, the only valid locations I'm interested in right now are those right next to the coast.

So: check to see which neighboring hexes the water can flow into. If it's valid, go there. If you hit a coast, split.


There are, of course still some issues. For one, the cellular automaton can't seem to figure out what's going on at the folds. This is a pretty common problem for me, but it's the constraint I decided to live with.

Ah, much better

Once all the coastal currents have been figured out, I'll just interpolate between everything to find out what happens in open water. A gross oversimplification, of course.

Then I'll need to figure out how that affects the on-shore winds and the moisture they carry, as well as where the hot and cold currents are (right now all the colors are red but that's just for contrast).

August 8, 2018

Currents I: Current Events

While I'm on a vector kick, I figured I'd tackle currents again. To really, truly model precipitation, I want a better model of where the hot or cold water is. I didn't actually spend that much work on it to begin with.

Most current modeling guides start off the same way. Head west along the equator, split north and south when you get to a coastline. When the current reaches about 45$^\circ$ latitude, it heads back west. If it originates from a pole, it's cold; if from the equator, it's hot. Warm and cold water meeting creates mild currents.

Theoretically that shouldn't be too hard to model. Unlike the wind model, I don't care about current strength, only direction. So I can start off with a set of vectors and propagate them out until the basics are modeled.

Keeping track of each vector is not the hard part; I just have a dictionary to store the angles. So each hex pushes water along its angle to the new target, which does the same on the next loop. The question is, what happens when I hit a coast? As mentioned before, it should split.

But, of course, this is not as simple as it seems at first. This is one of those problems where it's easy to visualize, but harder to implement in code (for me, at least). The code needs to be able to "see" the local coastline (or at least the coastal hexes) so that it can split the current in the correct directions.

For now, I've got the water moving a bit, but it won't split, and it can get trapped in a bay. The algorithm needs a way to "back out" and find an optimal path up the coast. I'm looking through a few options for classical algorithms to solve this problem (like Marching Squares or a walking algorithm).

Good

Not good
This stuff will also be useful once I extend the route finding code to the sea. It will be cheaper/easier to follow a current than to fight against it.

August 6, 2018

Wind I: Spirit of the Wind

I love what Here Dragons Abound did with wind. I want to do that, perhaps adding it to my pressure model.

Mainly, this will help with my move away from hand-drawing the rain. If I know where the wind is blowing, I can model the rain, yielding better results.

Once again, the primary source of my frustration is the sector rotation. It's hard to think in polar coordinates sometimes.

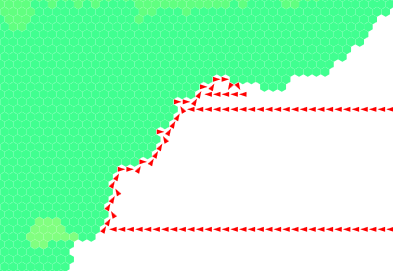
I applied a constant wind at an angle of 135$^\circ$, just for testing. The velocity is 25 knots, which is pretty high. I found a source showing a sea breeze strength of a max of 5 knots. No matter.

There are a few more rules for spreading the wind across land:
  • Every time a wind is propagated, it loses 10% of its strength
  • If it goes downhill, it gains some of that back depending on the slope
  • If it goes uphill, it's deflected up to 90 degrees. I use a logistic function to make a nice smooth transition, using $K=90$, $P_0 = 1$, and $r={\ln(89)\over 2400}$. The rate is one of the settings I'm playing with to get a good result. The 2400 is the change in altitude where the deflection angle is 45$^\circ$. So if I want winds to make it higher up a slope, I make this number bigger.
  • I talked about vector projection/rejection here, and I found that the best model for the wind is to use this to project the wind along the direction of the target hex. This "splits" the wind between the three hexes it's pointed toward the most.
  • Everything gets added up using vector notation. At first I thought this propagated stuff forward too much but it seems ok after a few bugs were worked out. And I'm not using real data so that can affect things.


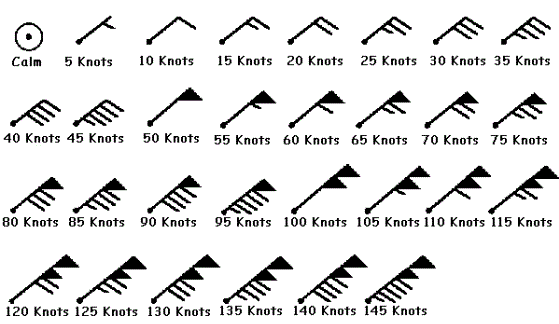
The wind barb notation shows the direction and strength of the local wind:


It's off to a good start. I'm going to think a bit more about the pressure systems so that maybe I can figure out how to integrate those into the model. There's also much tweaking to be done to get results I'm happy with.

Once that's done, I can move on to pushing moisture around.

July 4, 2018

Rivers III: Eroding the Coast

As I've continued to tweak the erosion system, I want to start working on how this erosion affects the coast. This is one of those projects that's big enough in scale that I don't even want to start; however, it's the perfect type of job to do when I'm hitting mental roadblocks elsewhere.

The first thing I did was identify all hexes lower than 50 feet. Next, I go through them and manually modify the coastline to include those hexes; if they're that low, the sea has encroached, or they've hit the water table.

A quick note: the height of the water table often means that lakes can be at very high altitude. There are some very clever ways to approximate this, but I'll leave those for another day.

Another note: while my system can deposit within my already-defined coasts (mostly seen as tectonic uplift), there is no mechanism to add new hexes to those in the land set. That might be a problem but again, not one I want to solve right now.


I'll repeat this process a few times, since I'm redoing the precipitation maps almost once a week now. Just cannot get them perfect. But the pursuit of perfection is itself a goal.

June 29, 2018

Finally, Holdridge

The Holdridge system is probably a bit more useful than the Koppen system for figuring out what things look like on the ground. At least, it's a start.


  • After redoing some of the temperatures, the ice-cap has been knocked down to a reasonable area. I still need to redo the rain so that the lines aren't quite so sharp. The number of ice-capped peaks has also been reduced, which is good. Those should be rarer than they were.
  • It's hard to remember that the continent on the right is not so much tall as it is wide/long. I tend to think of the interior as an inaccessible desert, but it's really only a month's journey from the sea. Of course, since its horizontally oriented, winds aren't as likely to blow directly inland.
  • Possibly because of the rain, there's not as much desert as I'd like to see. Deserts are thematically fun, and only two of them seems a bit sparse.
  • One thing I will look into soon: right now I use January and July as my summer and winter maps (and of course it's opposite seasons in each hemisphere). Going forward I'll be tinkering to see if I can use the "hottest" and "coldest" month each year to do the relevant annual sinusoidal approximations instead. For example, in the high latitudes, the hottest month will tend towards January; and in the lower, July. But I need a better understanding of how this works on Earth, first.