Erosion is a feature of both soil type and river volume. Certain soils erode faster than others, and yield different features. For now, I'm mostly concerned with how erosion affects the height of a 20-mile hex.
I think I like this model the best. This paper gives very good results and is easy to implement into my system.
\[\partial h = \partial t (u - k \sqrt{A} s)\]
where $\partial t = 2.5(10)^5$ years is the geological scale, $u = 5(10)^{-4}$ m/y is the tectonic uplift, $k = 5.61(10)^{−7}$ y$^{-1}$ as the erosion rate, $A$ is the total area drained, and $s$ is the slope between two nodes.
Strictly speaking, $u$ is a function of the tectonic collisions. For now, I'll set the value to a constant and see what happens. It'll be a bit more work to let the cells know if they sit above a collision boundary, etc.
No discussion of erosion would be complete without at least a mention of Wilbur. I'm not sure what model it uses to create its drainage networks and erosion, but it does give very pretty results and allows you to play with some of settings to get the type of surface you want.
For now, I don't want to bother with deposition (so no river deltas, a mainstay of fantasy maps), so I'll only bother in the case where $\partial h > 0$. I'm still working on the raw heightmaps, so it'll be a while before I have enough to test this model anyway.
I also need to create the precipitation maps before I do any major irreversible work on erosion, because the amount of rainfall will affect how much volume the rivers actually have, of course. This will be considered as a modifier to $A$, as the original model is precipitation-independent. Once that happens, I'll push out an update to this post. I'm working on this draft as I'm fiddling with settings, so I'm dangerously close to an unedited stream of conscious.

April 30, 2018
April 27, 2018
Elevation I: Height Generation
This is giving me a lot of trouble.
Mostly because I don't want to implement a true noise function (like Perlin) into the program, which is how this is done by everyone else.
I'm not everyone else, both because I'm lazy and because I work too hard to stay lazy.
In fact, I'd not mind a true noise function except for the fact that I specifically need to be able to place mountains where I want them, and let the random functions fill in the rest to give a more or less random feel. Too random isn't good either, as the earth itself has many more or less flat plains. We don't always want a totally generated terrain - sometimes we want control.
I still want to do the coastlines mostly by hand, and I want to do them first, rather than pull them out of a generated elevation map. That should come more or less first, thanks to the amount of difference between the rough and fine coasts. Based on how the rivers meet the coastline, though, I'll continue to fiddle with that some. My initial measurements of coastline give a length orders of magnitude shorter than Earth, because Earth's coastline isn't made up of straight line segments.
Once I get the heightmap done, I can work on rivers.
After some experimentation, I settled on a method with GIMP that works fairly well, but could be better. I use this set of brushes that give me a good pseudo-random terrain, then I hexagonize the surface. There are still parts of the surface that look artificial, but I'm hopeful that the erosion cycling will improve this somewhat. It does give me a surface that's a bit rougher than simply using Gaussian blurs. As I've discussed before, real-world terrain is simply not that smooth, and can be quite jagged in places.
April 25, 2018
Continental Breakfast
I've finally finished the rough draft of the coastline. Over the next few years I'll continue to chip away at these shores. This process itself will simulate the breaking of waves continually for thousands of years.
Black represents land, white represents not-land. Later on I'll add colors more like we're accustomed to seeing on maps; for now, the starkness of it helps me think uncritically about the shapes. If the rest of the project starts to slow down my posting schedule, I might zoom in and explore some of the individual coastlines in more detail to fill the gaps.
This picture represents my entire world canvas. The circumference of one of these hexes is 24,840 miles (Earth is 24,901), so this is almost exactly Earth sized. One side of the hex measures 207 hexes, or 4140 miles.

There is a lot of land on this map, especially in the southern hemisphere. I'm expecting a good deal of desert as a result - the water on land has to come from somewhere, and the pressure/precipitation systems in the south will probably not be super conducive to rich forests.
But we will see.
April 23, 2018
Meandering
There has been a lot of research done on why rivers take the shape they do. I'm going to use a lot of that work to make my maps look better. I was tired of the simple, hex-locked straight lines. They work, yes, but they don't show me any interesting features.
At first, I was just using spatial subdivision, but despite being fractal, it doesn't feel right for a river. So instead, I did way too much research on the science and modeling of real-world rivers.
I eventually settled (for now) on the model presented here:
\[\phi(\ell) = \omega \sin\left({2 \pi \ell \over L}\right)\]
\[x(t) = \int_0^t \cos \phi(\ell) \textrm{ d}\ell\]
\[x(t) = \int_0^t \sin \phi(\ell) \textrm{ d}\ell\]
\[t \in [0, L]\]
So far, not super complicated (for a parametric equation, that is). This is just the equation for a meander characterized by $\omega \in [0, 120^\circ]$ on a horizontal line. To fit this meander to a line at an angle $\theta$, the following transformation is applied (there is also a transformation of length and width):
\[x'(t) = A {x(t) \over x(L)} \cos\theta - B {y(t) \over y(L/2)} \sin\theta\]
\[y'(t) = A {x(t) \over x(L)} \cos\theta + B {y(t) \over y(L/2)} \sin\theta\]
\[A = L/4, B = A/5\]
If $\omega$ goes above about 120$^\circ$, the river will intersect itself. When this happens in real life, the river diverts through the shortest path (the point of intersection) and an oxbow lake is formed. I havne't implemented the code to make this a reality in the map yet, but I have to option to expand that in the future. For now, I've capped $\omega < 120^\circ$.
Technically speaking, $\omega$ should be a function (at least partially) of the soil type and slope. Since I am not yet worried about soil types (not sure I'll ever be), I'm going to tie it directly to slope. Higher slopes mean less meander (smaller $\omega$).


Technically speaking, $\omega$ should be a function (at least partially) of the soil type and slope. Since I am not yet worried about soil types (not sure I'll ever be), I'm going to tie it directly to slope. Higher slopes mean less meander (smaller $\omega$).

I'm still working on the elevation maps, so in lieu of using slope, I'll grab a random angle for $\omega$ while I'm testing.

In future iterations, the scaling parameters will be functions of the underlying topography. In addition, my endpoints are merely the centers of each hex, shifted by a random amount in $xy$. I think I can use a little clever vector addition to make that look a bit more natural, but more on that later once I have my thoughts put together.
April 20, 2018
Rivers I
Some sorta connected thoughts about rivers:
- Obviously rivers flow from high to low [citation needed].
- On the map, each river's drainage (the total amount of area that drains into it) can be represented by the width of the stroke.
- However, drainage is not the same for various amounts of precipitation. In the desert, it might take a lot more hexes ($\equiv$ area) to produce 1 "point" of drainage.
- Therefore, when creating the rivers, each hex can keep track of the raw drainage number. Then multiply by a factor that considers precipitation.
- In real life, this number would be modified by soil type, rock bed composition, etc. I don't think I'm to that point of detail yet. I don't think I'll ever be. Probably.
- Keep track of which hexes have been sources for rivers (drainage = 1)?
- Interestingly, this method creates tons of endorheic drainage basins (drainage basins that do not drain to the ocean). They have no natural outflow. If precipitation is high enough, the river will carve a path through the surrounding terrain to get to lower ground. Alternatively, a lake will form and fill the terrain to the point where it can find an outlet. Sometimes, water just can't get out of the area, so it forms a lake which maintains its level either through seeping into the ground or by evaporation in certain atmospheric conditions.
- I can remove almost all of those basins, and I think I will. Perhaps I'll let it slide if it's a certain distance from the coast. But for now, it's quicker to just raise the area a bit so the water can drain out. All water leads to the sea, so far.
- The more correct way to handle the basin is to check the evaporation rate and balance that against seepage and inflows. That may be on down the line.
- Once this is done, we can apply a bit of geology to erode down the landscape based on how much river is flowing through a hex.
- Terrain generation using procedural models based on hydrology
April 18, 2018
A Question of Scale
One problem I see popping up in a lot of fantasy maps is the scale of features on the map. Maps which purport to show areas the size of Russia have four major cities, one big river, and a few clearly marked mountains.
That's just not the case for real-world geography. There's a lot of stuff in the world. There's a really high chance that your map should be stuffed full of cities and other human effects. My map currently plans to cover approximately 37 million square miles (Earth is around 57.5 million).
Averaging terrain into 20-mile hex blocks also doesn't quite fall out how I expected. This became starkly obvious when I was working with the height maps. At that time, I was placing hexes in 1000 ft increments. But if you think about it, 1000 ft over 20 miles is about half a degree of slope. You wouldn't even notice that. It certainly doesn't qualify as a mountain.
A 20-mile hex has an area of about 346 square miles. Conveniently, this is close to the base area of Mt. Everest. Now, Everest does not rise straight up from sea level, but let's imagine it does. If we imagine this mountain as rising from sea level to 26,000 ft inside a single hex, that's an average slope of only 26 degrees! And that's just calculating using the highest point. Even if we use the average (13,000 ft), then Everest would appear on our map suddenly jut up from our plain, and the 20-mile hex map would deceive us as to its actual height. A mountain slope is usually (but not always) around 30-35 degrees.
That really changes my perspective on how mountains look on a height map. If you look at a hex-binned height map of Earth, you can tell where the "high places" are, but not necessarily individual mountains. The following picture is a 20-mile hex map (roughly) of Earth's topography in North Italy and the Alps. Sorry about Genoa, it got wiped out when I processed the image in Gimp. Data from here. As you can see, the real topography is barely discernable from the 20-mile hex averaged height. Le Mont Blanc (15,777 ft) isn't even the highest hex here. Nearest I can tell, the highest hex here contains Äussere Schwarze Schneid (10,686 ft) among others. It's very interesting that there are so many mountains packed into here that just plain don't show up.

Let's get back to definitions. Mountains are pretty roughly defined. As I was researching the slope numbers above, I remembered that Olympus Mons, the highest mountain in the Solar System, has a slope so gentle you probably wouldn't notice if you were walking up the side (this is not so different from the outskirts of many shield volcanoes on Earth). It's also extremely huge, not only in height but in area. It would nearly cover France! I've seen many fantasy maps with similarly sized mountains.
None of this is necessarily a problem. It might be good enough to define "mountainous terrain" for the purposes of the world map. But individual peaks might be more difficult to place. 346 square miles is a lot of area for those peaks to appear in. That might be a problem to save for the 1-mile hex project in a few years.
The elevation affects base temperature, precipitation, and travel time (important for trade routes). Therefore, figuring out the best way to create and describe it numerically will be important.
I used the Hexagonize Script for GIMP to create the hex maps from the height data.
April 16, 2018
Don't Cut Yourself
See this post about mountain scale.
When thinking about how to create realistic terrain for a gaming map, one must consider, in detail, much of the real world. This leads to some beautiful finds.
Where are these places on our maps?
When thinking about how to create realistic terrain for a gaming map, one must consider, in detail, much of the real world. This leads to some beautiful finds.
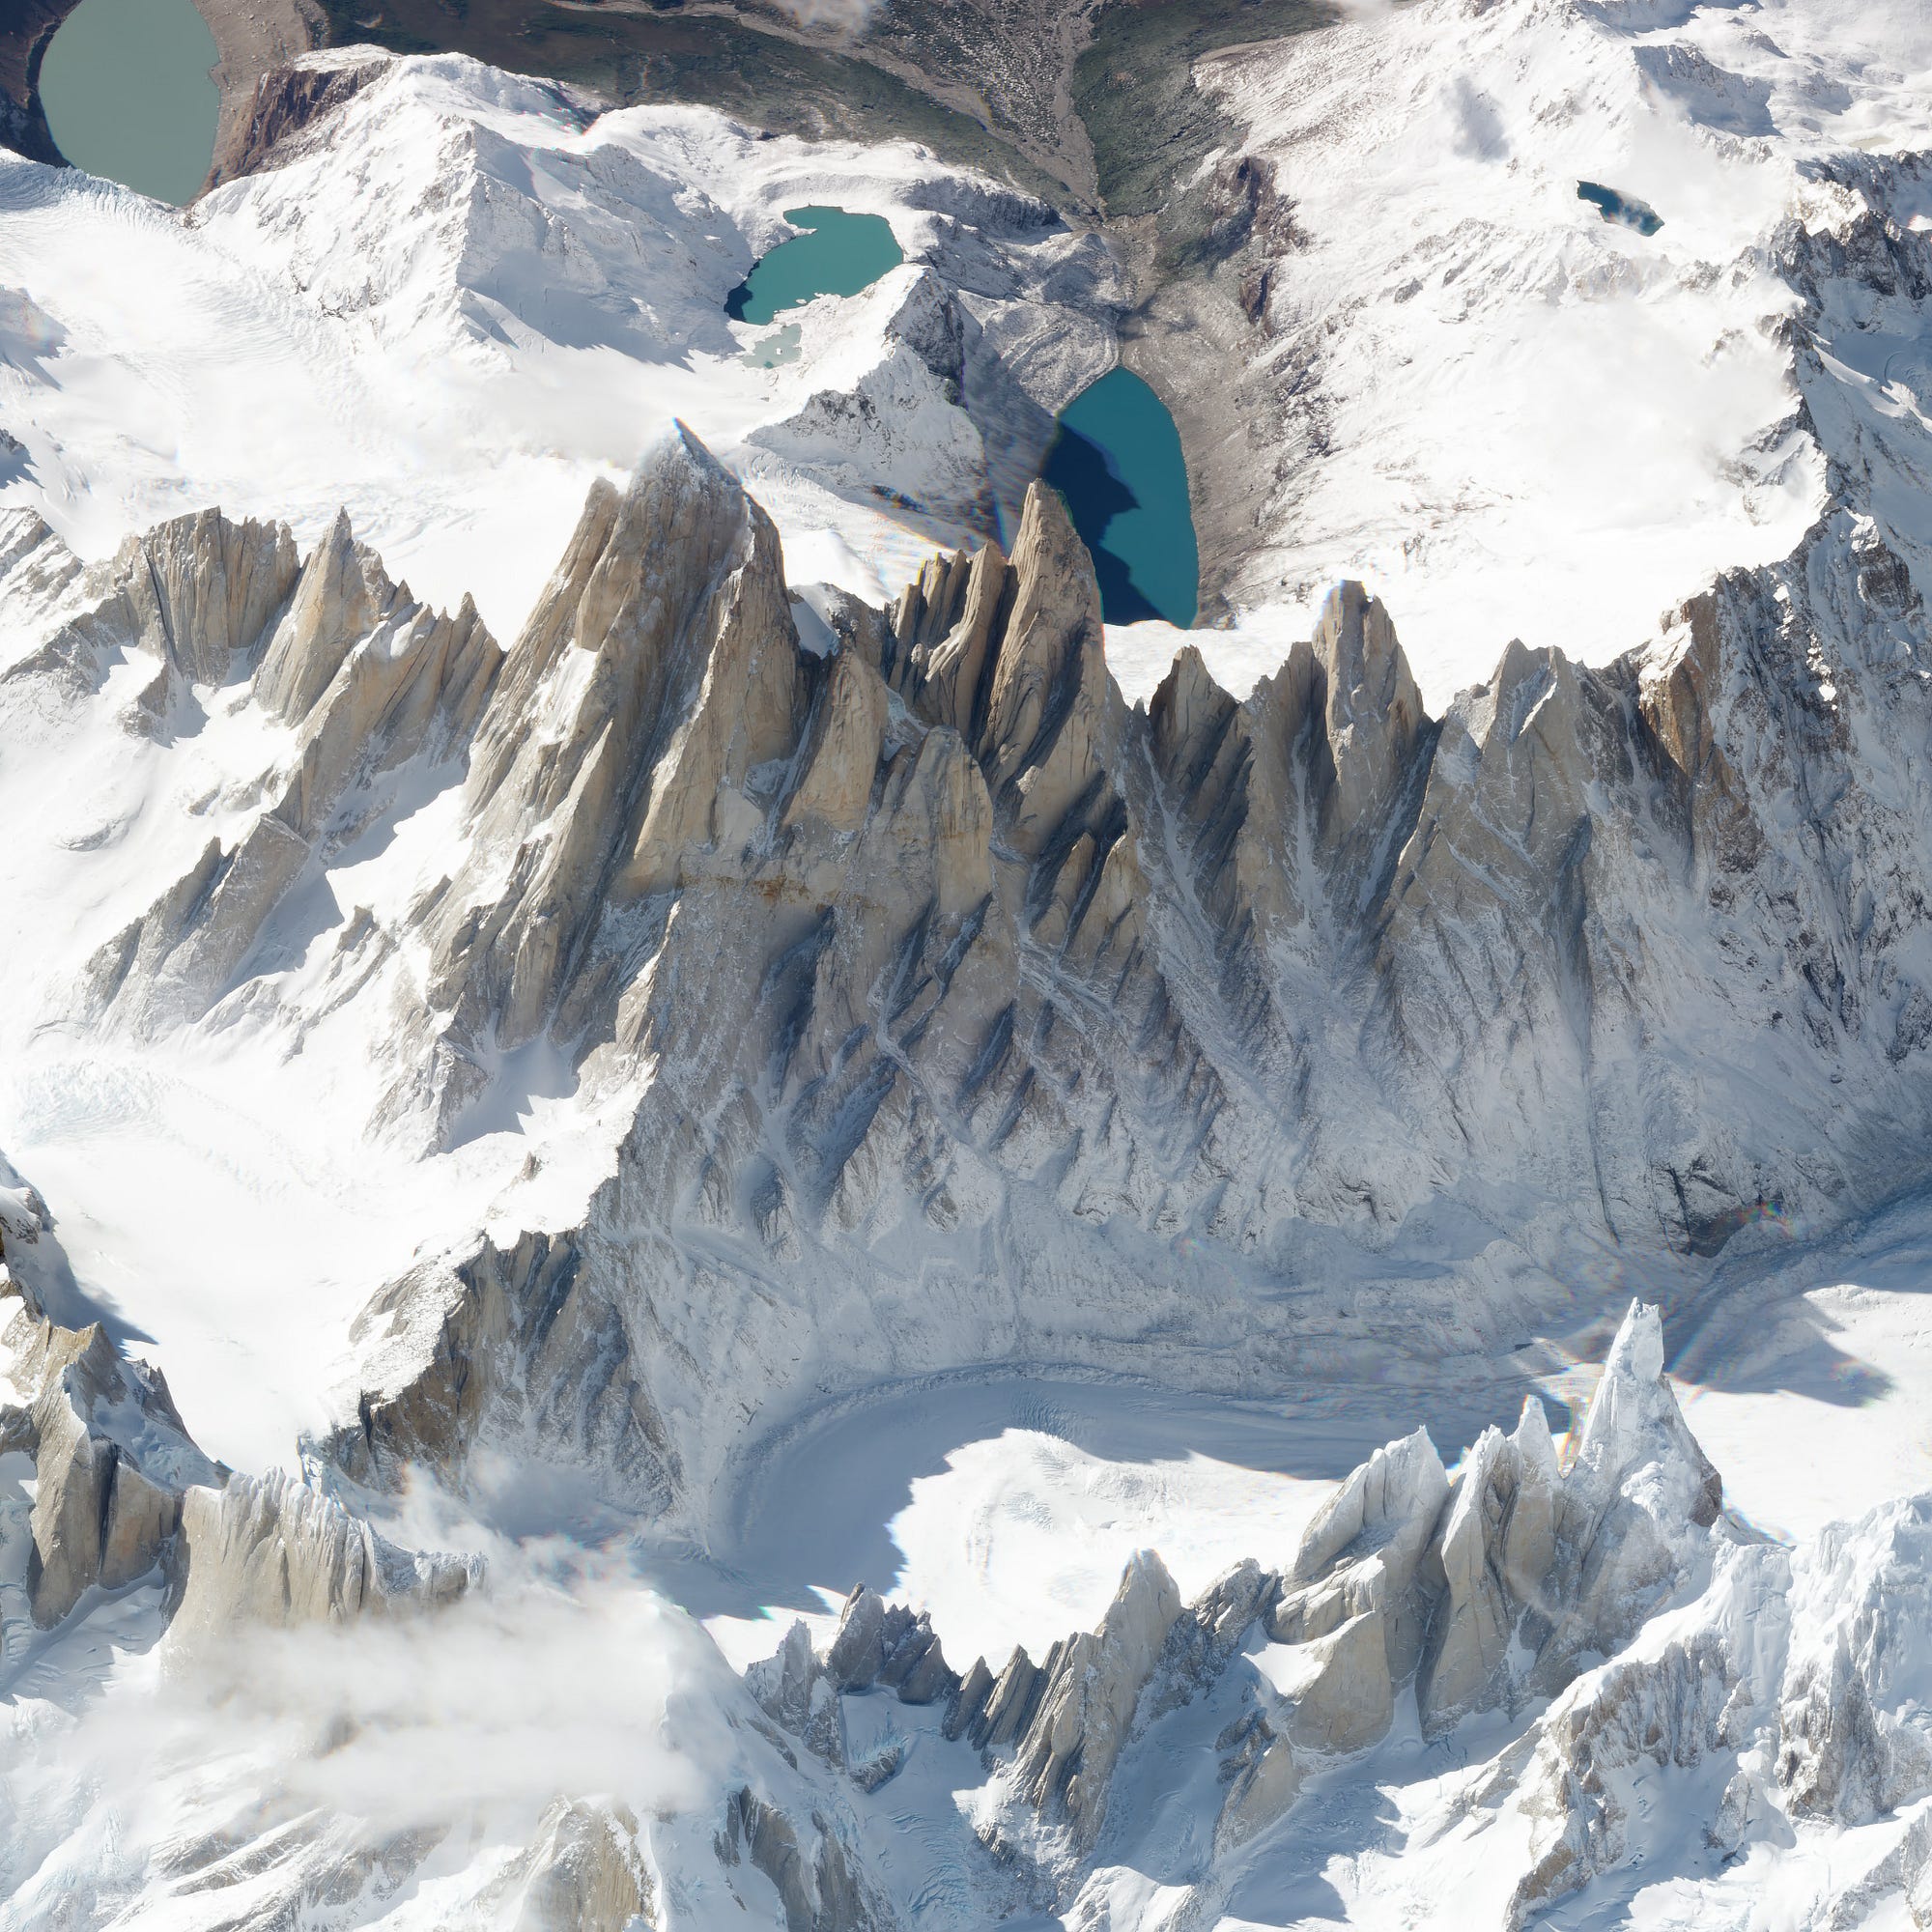 |
| Monte Fitz Roy, Image ©2018 Planet Labs, Inc. |
April 13, 2018
Coastlines
I look at real-world maps a lot. It's a good exercise and it helps me uncover interesting features that I'd like to incorporate into my own world.
One thing I notice consistently is that real world coasts are a lot smoother than most fractured fantasy coastlines. Many years of oceanic action will do that. Above (or below, if we're in the southern hemisphere) the 70th parallel, the smoothness gives way to glacially roughened fjords, such as the coast of Norway or southern Chile (this is not a law but serves as a roughly observed rule of thumb).
Coastlines also demonstrate fractal properties: that is, they display similar characteristics at different scales. A smooth coastline is smooth up close. A fjorded coastline is fjorded up close. This means I don't have to worry too much about scale while I'm drawing all the coasts by hand. There's a danger here because when you're doing this much work by hand, it's easy to fall into repeated patterns.
Despite this, there are no straight lines in nature. So, once again, I have to make a tradeoff between reality and gameability. In this case, lots of smooth curves exponentially increases the size of my SVG, so I'm going to make all my segments straight, at least. I add nodes every 5 miles or so, and jitter them slightly (by about 1 px or around 1200 ft) so they're not perfectly smooth. Just enough roughness to make it look good. Thats still enough detail to tell a good story.
Great care must be taken with glacial areas so as to not make the fjords too big. Maybe I can trace some or Norway or Chile's coast to get a more accurate characterization. Without actual fjord coast to trace or copy, it's very difficult to predict how those "cracks" will occur. Usually what happens when I encounter a situation like this is I do a bit of research and come up with a model that would shock any serious scientist of the field, but yields sufficient results for my map. I don't know that that's possible.
My iterative process does serve to make the coastline somewhat more natural. I've done a few tests, considering how rivers affect the point at which they reach the sea (or their destination body of water). So I am optimistic that the various other processes I subject the map to (river erosion, deposition, mountain chains) will positively shape the coastline to appear more natural and less ad hoc.
I also have learned that I need to work backwards to the places I actually want to start in my game. I tend to refine my technique of course, so the early parts are always worse. In mass-scale artistic projects, I either get lazy or better. But I usually don't maintain the same standard.
Resources of interest:
April 11, 2018
And the Evening and the Morning Were the First Day
This is a topic that is near and dear to my heart, because it goes so far beyond the bounds of nerdery that it boggles my own mind to imagine that I spent my time on this.
When does the sun rise? When does it set?
This changes depending on where you are on the Earth, or if you're on a mountain. So, what time? Don't cheat.
Start with these variables (assuming spherical planet, normal orbital, massively dumbed down):
\[c_E, r_E, n, h, y, a, G, e, \Pi, m_S, m_E, \varepsilon, \phi, \theta\]
Where $c_E$ is the circumference of your world, $r_E$ is the radius, $n$ is the number of days since the beginning of the year, $h$ is the observer's height above sea level in feet, $y$ is the number of days in the year, $a$ is the distance between the world and the star, $G$ is the gravitational constant, $e$ is the orbital eccentricity, $\Pi$ is the argument of perihelion, $m_S$ is the mass of the sun, $m_E$ is the mass of the world, $\varepsilon$ is the world's axial tilt, $\phi$ is the observer's latitude, and $\theta$ is the observer's longitude.
Got all that? Now for the hard parts.
Find the standard graviational parameter $\mu = G \cdot (m_S + m_E)$ of the system. The mean anomaly $M$ is then found by:
\[M = \sqrt{\mu \over a^3} {n \over y} {24 \cdot 60 \cdot 60 \cdot \textrm{ years} \over \textrm{seconds}}\]
To find the true anomaly $\nu$, we must use first-kind Bessel functions $J_\alpha$ and $\beta^m$:
\[\beta^m = \left({e \over 2}\right)^m \left(1 + m \sum_{t=1}^\infty {(2t + m - 1)! \over t! (t + m)!} \left({e \over 2}\right)^{2t}\right)\]
\[\nu = M + 2 \sum_{s=1}^\infty\left({1 \over s}\left(J_s(s \cdot e) + \sum_{p=1}^\infty\left(\beta(p) (J_{s-p}(s \cdot e) + J_{s+p}(s \cdot e))\right)\right)\sin(s \cdot M)\right)\]
Make sense? Great! That's the hard part. I don't recommend doing it by hand.
With those solved, we can find the equation of the center $C$.
\[C = \nu - M\]
And then the ecliptic longitude of the sun $\lambda$.
\[\lambda = (M + C + \Pi + 180^\circ) \textrm{ mod } 360^\circ\]
Then the declination of the sun $\delta$.
\[\delta = \sin^{-1}\left(\sin(\lambda)\cdot\sin(\varepsilon)\right)\]
The height correction $h_{corr}$ is given by:
\[h_{corr} = -1.15^\circ \sqrt{h\over\textrm{ft}} {1 \over 60}\]
Then the hour angle $\omega$ is given by:
\[\omega = \cos^{-1}\left({\sin(-0.83^\circ + h_{corr}) - \sin\phi\sin\delta\over \cos\phi\cos\delta}\right)\]
Almost there. Now for the equation of time, which sounds pretty high fantasy to me.
\[\Delta t_{ey} = -2 e \sin M + \tan^2{\varepsilon\over 2} \sin(2 M + 2 \lambda)\]
I also add a correction for the time zone, but this will depend on whether your world has time zones. Otherwise, the calcuation will yield sunrise/set relative to your equivalent of Greenwich Observatory.
\[TZ = -{\theta \over 15^\circ}\]
The final bit of information is the calculation of the Julian transit (or solar noon). This is when the sun is directly overhead.
\[J_t = 0.5 + {\theta \over 360^\circ} + \Delta t_{ey} + TZ\]
Basically done. The hour angle $\omega$ is the difference between the sunset/rise and $J_t$!. $J_{set}$ and $J_{rise}$ will be the hour of set and rise. Minute and seconds can be derived trivially.
\[J_{set} = \left(J_t + {\omega\over360^\circ}\right) 24\textrm{ hr}\]
\[J_{rise} = \left(J_t - {\omega\over360^\circ}\right) 24\textrm{ hr}\]
The last step?
Draw your analemma (a plot of $\delta - \phi$ vs $\Delta t_{ey}$).

April 9, 2018
Tectonics on the Map
The first thing to notice is that Earth has a ton of major and minor plates. It's much more complicated than I'm going to try and tackle, at least for now.
(As an aside, as I build this system up, it should be less of a pain to make and propagate changes in the future.)
I only have 11 major plates (and no minor plates). Most of these are concentrated in the northern hemisphere. Red indicates a convergent zone, blue a divergent zone, and green a subductive boundary (I'm using the word zone here to refer to the general area around the boundary, but it has a specific geologic meaning in this context that I'm ignoring).

I've also included the coasts on this image, if only to show how the coastline follows the dOO boundaries. Figuring out how the different convergent zones (which cause mountains) match with the divergents (which "push out" coastline) is an interesting exercise.
The file above is massive - at only 10 dpi, which is barely any detail, it's a 1.6 MB PNG. I have some serious thinking to do on the design considerations here. Each hex is designed at 100 px. At full resolution that would make the map 54 feet high. Enough detail for ya?
(As an aside, as I build this system up, it should be less of a pain to make and propagate changes in the future.)
I only have 11 major plates (and no minor plates). Most of these are concentrated in the northern hemisphere. Red indicates a convergent zone, blue a divergent zone, and green a subductive boundary (I'm using the word zone here to refer to the general area around the boundary, but it has a specific geologic meaning in this context that I'm ignoring).

The file above is massive - at only 10 dpi, which is barely any detail, it's a 1.6 MB PNG. I have some serious thinking to do on the design considerations here. Each hex is designed at 100 px. At full resolution that would make the map 54 feet high. Enough detail for ya?
April 6, 2018
Tectonics: a Primer
One of the fundamental steps in worldbuilding is the creation and analysis of the plate tectonics, assuming your planet has them (Mars does not, for example).
Most importantly, the tectonic map can inform me where to place mountains, continents, and the like. Like any other topic I'll discuss here, the science of this can get extremely complicated. So I have to make some concessions and shortcuts. My apologies in advance to the geologists. I have tried to strike a balance between accuracy and simplicity.
I'll take a moment to mention GPlates. I've never used it, and I don't plan to for this project, but many people swear by it as a crucial step in accurate tectonics.
Tectonic plates themselves are not as much interest to me as what happens at the boundaries. There are four major kinds of boundaries:
- Convergent (c)
- Divergent (d)
- Subduction
- Transform
I'll mostly ignore subductive and transform boundaries as individual categories - I've found it's easier for me to characterize them as either c or d depending on the relative directions of the relevant plates.
What these look like will depend on the type of crust covering the plates at each boundary, oceanic or continental. Since continental crust is less dense, it "floats" on top of the oceanic, and will generally be the one on top when one plate is forced on top of another in covergent or subductive processes. It's also important to note that oceanic crust is not necessarily covered by water, and vice versa for continental.
Hence, I can simplify my plate interactions to six total types.


- Convergent oceanic/oceanic (cOO). Forms volcanic island chains as the submerging crust strikes magma plumes.
- Convergent oceanic/continental (cOC). May form volcanic chains on the coasts of continents, as well as back-arc basins, which are very interesting.
- Convergent continental/continental (cCC). This is where the largest mountain ranges will occur.
- Divergent oceanic/oceanic (dOO). The source of new oceanic crust. Causes mid-oceanic ridges, but these are not usually visible above water. I'm not worried about these since I'm not mapping the surface of the ocean...yet. I must mention Þingvellir, a park in Iceland where the dOO is actually above water.
- Divergent oceanic/continental (dOC). Doesn't really happen due to the underlying physics. Oceanic crust is itself formed by divergent boundaries (and eventually becomes continental over time).
- Divergent continental/continental (dCC). When the divergence happens between continental crust, you get graben/horst features and sometimes volcanic activity. This opens an avenue for sea ingress, although I wouldn't build any port cities here that you wanted to last for more than a few million years.
Now what? Well, despite my raging against ad hoc, I've already committed that there will be certain features I want to see in my world. Part of this is to use my own brain as input to simulation, to prevent the homogenous worlds that many procedural generators produce. With this information, I can begin drawing my tectonics based on where I want mountains or continents to go, and the rest of the world will be "filled in" based on that.
April 4, 2018
Hex Layout
As with many topics, I defer to Alexis's ideas on this issue. There are lots of arguments online in various forums about which map projection to use, Mercator or Equirectangular, but none of these approach the simplicity of the hex-ring map. It has its drawbacks. Most wrapped hex maps use 20 major triangles, which can wrap around a globe in an isocahedron. This one uses only 12 major triangles, so its not expandable to a 3D shape in the same way. I like this system because it seems more gameable to me.
Inkscape has a built-in grid option for pointy-top hexes (some people have extremely strong feelings about pointy-top vs flat-top hexes). I'd like to do the whole thing in an SVG file, so I can use Inkscape to edit that manually, and Python to manipulate what I can on the code side. SVG is a vector graphics format, so it lends itself well to programmatic manipulation. Most importantly, its the type of coding I'm more familiar with; there are many image manipulation programs for raster graphics, but I'm not versed in those.
The first thing I'd like to do is have a way to represent which hex is which. In the SVG spec, each hex (at least the ones that are explictly placed) have defined points. We can grab these out of the file and do some math manipulation to find the center point. This gives us a reference for each hex relative to the whole document coordinate system. But this isn't the coordinate system I want to use: a large decimal Cartesian coordinate isn't that helpful either in game or when giving each hex an ID.
So we manipulate each hex center coordinate into a latitude-longitude string representation (I am not using Eisenstein integers as coordinates, but I mention them here because they are cool). This gives rise to a few problems. The first is that we are using hexes, not a typical square grid. This means that the coordinate transformation is already a more complex problem than rectangular coordiantes. The second problem is the arrangement of the two circles around the poles. Essentially, even if we were using the "simpler" matrix transformation, we'd need a different matrix for each region of the map, depending on its base orientation and location.
The solution for this is a series of equations (largely derived through trial and error) that transform the initially derived lat-long into the correct one. On its face, it's essentially a matrix transformation, but I only know enough math to be dangerous, and as mentioned, the hexes are non-continuous. Every other ring is offset, which leads to all sorts of problems (at least for me). This step takes a while, because it has to churn through every placed hex. Once I get all the equations written and each edge case accounted for, I can clean up and optimize the code a bit.

There are a total of 257,096 hexes which could possibly be used; I expect the number of land hexes to be about half that (Earth is roughly 70% water), so that might have some interesting effects on the weather, without the preponderance of ocean to affect the water cycle. Potentially many inland deserts, forcing resource competition along the coasts.
Like any good scientist, I'll take way more time to figure out a general solution to a problem than just doing the thing. What I should have done is follow Red Blob's guide to beautiful hex manipulation. But I didn't (or haven't yet).
Since I haven't gotten the climates worked out the way I want them, I don't have a color palette designed yet. I'm not sure the exact types of terrain I should aim to display.
April 2, 2018
Motivation
I've been playing D&D for only a few years now, but I've always been a mapper at heart. In fact, part of the reason I was drawn to DMing is the kind of control I have over the cartography. I'm also a sucker for realism; the standard medieval countryside of many D&D settings doesn't appeal to me.
Even all that wouldn't have gotten me to where I am today. My very first campaign saw my PCs in a tiny village in the badlands of a fading empire, on the shores of a wide sea, which existed to provide a port-of-call for ships carrying valuable spices and wine across the ocean and push them on down the coast towards the capital. So I got to thinking: how far is this trade route? How does that affect the prices of those goods? Is it even worth the trip? (No, as it turns out.)
I wasn't satisfied. To make things worse, D&D 5e, with its emphasis on simplicity (good in many ways) provided no help whatsoever in thinking about consistent production of goods, and supply and demand. Sure, I could say "wine is 2x more expensive here" but that wasn't good enough. I'm an engineer by training, and a data cruncher for fun, so that didn't cut it for me. To be honest, there are very few places where 5e is in fact consistent.
Then I found Alexis. His trade system was exactly what I'd been looking for! He'd based his detailed system (and gorgeous maps) on a fascimile of the real world. Regardless, I was hooked. I began thinking about how to install this system for my own world. Even better, if I could make it flexible, able to accept any inputs, that'd be perfect. I know enough Python to be dangerous, so I threw together a few generator functions and started plugging away.
...Only to find that Maxwell had followed nearly the same path, with much prettier results. I wasn't discouraged - after all, one size might not fit all, and I have much to learn from this convergent evolution. But that body of work also sparked some of my own dormant ideas.
I'd continued to work on my maps, both because I love doing them and because a knowledge of local and global terrain was necessary to build the table of trade routes. But I still wasn't very happy. It was so much work, and I'm very impatient. Alexis has had the benefit of many years to build his system...I wanted it all and I wanted it now.
But what if I could automatically generate many of these resources? What if I gave my program a map, and it produced the tables I needed? Not only which resources could be found where, but the distances between them? There was no end to the data I could generate from that. And from data, comes stories. I wanted detail, informed by reality, of what sorts of things happened in a given area.
So I started researching.
There's been a lot of work done on procedural generation for stuff like this, a lot of very good work. But the systems I've looked at are never exactly what I wanted. Many systems use Voronoi polygons - I wanted to stick to hexes. Voronoi polygons look good and make pretty terrain, but they aren't immediately gameable like a hex is (at least to me). The other problem is that most procedural generation is either random or starts from a seed. I want the ability to make things that don't make procedural sense. The world doesn't always make sense - sometimes rivers DO split (this is very rare, though). Sometimes cities pop up in odd or unfavorable places. Real life is dirty, and the infinite number of choices available in the growth of terrain and civilization means that a pure procedural world will have too many smooth edges.
Also, I'm not that good of a coder.
So I decided that I'd use an SVG format for my map. I can manipulate the file programmatically (with Python and BeautifulSoup4), and manually (using Inkscape).
From the terrain map, I can generate resources. I can get a list of settlements (and generate new ones) to collect and refine them. I can determine lengths of trade routes. I'm a big fan of decentralization, even at the cost of a little initial speed.
This blog is to be a repository for some of my thoughts and the things I come across in my research. I'm not looking for advice, feedback, or praise, although I won't say no to those.
It's not going to be a quick project. And even though it's not the best or the cleanest, it's mine.
Subscribe to:
Posts (Atom)