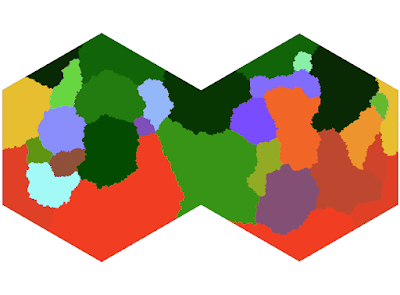
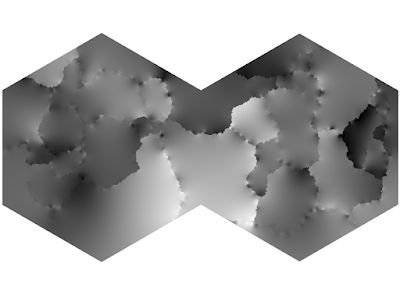
However, I think I can get some mileage out of using plates themselves to generate a better uplift map. The code for this is pretty simple, some general flood-fill algorithms along the fault lines:

In this model, each hex is only affected by the faults it actually borders:

This gives us some smooth transitions and some stark differences - which I feel effectively captures the action of subducting and overlapping plate faults.
In reality, the difference between ocean and land is not a unimodal curve. Earth differs in this regard because it has uniquely defined oceans in the first place.
However, no one is interested in fitting a curve to this specific shape. Until now.
This consists of a piecewise curve as:
\[
h_1(x) = 55 \exp\left(-\frac{x}{0.65}\right)\textrm{ if }x >= 0
\] \[
h_2(x) = 55 \exp\left(\frac{x}{0.15}\right)\textrm{ if }x < 0
\] \[
h_3(x) = 15 \exp\left(-\left(\frac{x + 4.6}{1.5\sqrt{2}}\right)^2\right)\textrm{ if }x < 0
\]
Where the full cumulative distribution is given by \[H(x) = \int_{-11}^x h_1(n) + h_2(n) + h_3(n)\textrm{ d}n\]
This is in units of 1000 km, which is not what I want. However, if I scale both the inputs and outputs to $[0,1]$, I get a non-linear I/O curve similar to a gamma correction.
Doesn't look quite how I wanted it. Lets do a simulation run.
Starting to see some of those shapes: but the distribution is not great. Most of the mountain chains are reasonably distributed except for the big pile in the middle.
I'll continue to work on this. I'm getting closer to what I want.
However, no one is interested in fitting a curve to this specific shape. Until now.
This consists of a piecewise curve as:
\[
h_1(x) = 55 \exp\left(-\frac{x}{0.65}\right)\textrm{ if }x >= 0
\] \[
h_2(x) = 55 \exp\left(\frac{x}{0.15}\right)\textrm{ if }x < 0
\] \[
h_3(x) = 15 \exp\left(-\left(\frac{x + 4.6}{1.5\sqrt{2}}\right)^2\right)\textrm{ if }x < 0
\]
Where the full cumulative distribution is given by \[H(x) = \int_{-11}^x h_1(n) + h_2(n) + h_3(n)\textrm{ d}n\]
This is in units of 1000 km, which is not what I want. However, if I scale both the inputs and outputs to $[0,1]$, I get a non-linear I/O curve similar to a gamma correction.
 |
| Hm. |
Starting to see some of those shapes: but the distribution is not great. Most of the mountain chains are reasonably distributed except for the big pile in the middle.
I'll continue to work on this. I'm getting closer to what I want.


