April 8, 2019

History VI: It Is Well That War Is So Terrible

The enemy said, 'I will pursue, I will overtake, I will divide plunder, my desire will be full of them, I will draw my sword, my hand will destroy them.' - Exodus 15:9 LEB

The Heidelberg Institute for International Conflict Research (HIIK) defines 6 levels of violence intensity between nations.

lvldesc.
0no conflict
1dispute
2non-violent crisis
3violent crisis
4limited war
5war

Levels 0-2 are non-violent, while 3-5 are escalated into actual conflict. This fascinating paper gives me a great set of models to use to predict conflict between nations [1]. For example, a variable for "border conflict" $C$ can be used as a "bad neighbor index": \[C = \sum_1^n x_i p_i,\] where $n$ is the number of bordering nations, $x_i$ is the previous year intensity for nation $i$, and $p_i$ is the percent of border shared with nation $i$. This paper [2] takes it a step further by providing a transition probability matrix between peace and war!

However, Hegre's robust model only transitions between no conflict (0-2), minor conflict (3), and major conflict (4-5). So I can use this to create a full transitional matrix between the 6 levels (using my old friend Inverse Distance Weighting).
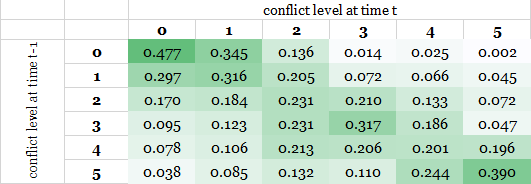

After a bit of testing, that seems like it transitions way too quickly. My tests devolved into war within 10 years. Guess that's possible when everyone is super touchy. Let's try something more fundamentally based.


That does a little better. Doing a few tests shows it has a nice spread leading up to war, between 70 and 280 years for 5 tests. Perhaps it could even be modified per nation. Some are naturally peaceful, some are naturally expansionist. It is quite obvious from even a few tests how massively the matrix affects behavior.


At creation, every nation will be at Level 0 with its neighbors (barring circumstances like a secession from the parent hegemony, in which case it would already be at war).

However, this transition matrix is situationally agnostic. It doesn't know how much border I share with that crazy king who's always eyeing my silver mines. It doesn't remember the bloody civil war in which my people were brutally defeated but still nurse their wounds with undaunted pride and opportunistic ears. So while this system can add some substantial random salt, it's not the end all be all. We need a few more mechanics and numbers for that (rebellions, treaties, overall population contentment, confederations, etc). But for now we will assume that war is only governed by this single mechanic.

If two nations are at war, they will seek to capture the bordering city which has the highest raw desirability.

Now, how do two nations actually fight? There has been some work done about this from a game design perspective, but I'm particularly drawn to the Lanchester equations. These are very simple equations which describe the attrition rates of two armies of size $A$ and $B$ at battle: \[A'(t) = - \beta A(0)^{2-n} B(t)\] \[B'(t) = - \alpha B(0)^{2-n} A(t)\], where $\alpha$ and $\beta$ are the combat effectiveness of $A$ and $B$ respectively, and $n$ is the attrition parameters. $n=1$ is the linear case, where one solider kills one soldier, but $n=2$ is the square case, more applicable to modern warfare. It also turns out that when a defender is fortified, the attack attacks linearly, while the defender defends with the square law. This makes sense intuitively - it is difficult to take a position. So how do I use this in my game?

First I need to determine the raw number of troops. I'll pull random low percentage (3-6%) from the rest of the country to determine a standing army size, and 5x that from the attacked hex. This includes both urban and rural populations (right now, my rural calculation is 5 times the infrastructure number but I don't like this and will address it soon).

Potential issues: it doesn't make much sense for the entire standing army to reinforce a single city in every case. It may not be strategically important, or it may be the fortress upon which the whole balance hangs. There's no way to know, and I'm looking for verisimilitude, not accuracy.

Consider the following free cities:
  • Wienw, population 559 (rural 11,670), founded 3604. Militarization rate: 5.6%. Total military: 2,860.
  • Aedcad, population 6,694 (rural 31,110), founded 3325. Militarization rate: 4.9%. Total military: 1,742.
Aedcad attacks Wienw but is met with a much larger defending force (Wienw gets a boost because it's being attacked). To figure out who wins and how many troops are lost, I need a measure of $\alpha$ and $\beta$. If one side has steel swords and the other has bamboo canes, it almost doesn't matter how many people you have with canes. Technically, I can get numbers for weapon availability by leveraging the market system, but I can't computationally afford to do that every simulated year. So instead, I'll use the desirability and infrastructure indexes, which are updated regularly. The theory being that resource availability yields a higher desirability, and a higher infrastructure gives you a better mechanism to train your troops. For Wienw ($\alpha$) and Aedcad ($\beta$), this gives \[\alpha = {0.7368 \cdot 103 \over 10} = 7.589\] \[\beta = {0.5242 \cdot 21 \over 10} = 1.101\] The indexes are averages of the entire hegemony (which in these cases is only one hex) and they are divided by 10 to bring it into a reasonable range. A soldier from Wienw can kill almost 8 enemies before he dies, but an Aedcadian can only manage around 1.

The solutions for the above equations are too long to display here, but suffice it to say that Aedcad was soundly defeated (using $n=1.25$). Defenders will hang on until they have lost 50% of their troops; attackers will break off if they have lost 30%. Aedcad (red) loses 528 men in the attack - a costly battle, and Wienw (blue) only loses 467. Because these are single cities, it's easy to just subtract the casualties; in the case of larger hegemonies, all cities will lose some in proportion to how many they supplied.


However, as robust as this may seem, I don't know if it will be fast enough to use as my primary engine of war. I'll have to run some tests with some non-linear solvers. But otherwise, it's a fair start.

Potential issues: why would Aedcad attack Wienw in the first place, given Wienw's military and numbers advantage? However, we have information that Aedcad does not: perfect information on the likelihood of a victory or loss. Until we salt the system, Aedcad will always lose this battle. It's just a question of by how much. I'd also like to create some castles/other fortifications, because these are gameably cool, would most likely be built in highly contested areas, and would give a significant defensive boost.

References:

  1. B. Boekestein, “A Predictive Logistic Regression Model of World Conflict Using Open Source Data,” Air Force Institute of Technology, 2015.
  2. H. Hegre, J. Karlsen, H. M. Nygård, H. Strand, and H. Urdal, “Predicting Armed Conflict, 2010-2050,” Int. Stud. Q., vol. 57, no. 2, pp. 250–270, Jun. 2013.

April 7, 2019

Demographics V: Urbanites

I've struggled for a while to come up with a reasonable mechanism to produce rural population numbers. The city numbers are determined by the growth system, but it doesn't account for those living outside the walls.

My first thoughts were that it should depend on the urbanization rate $u$ and infrastructure of the entire hegemony. Given $u$, the total urban population of the hegemony $P_u$, the total infrastructure of the hegemony $I_t$, and the local infrastructure $I_i$, I should be able to arrive at a reasonable rural population $P_r$: \[P_r = {I \over I_t} \left({P_u \over u} - P_u\right)\] So areas with high infrastructure will pull in a greater proportion of the total rural population. Makes sense at first.

But this can yield unreasonably high local densities. Considering the hegemony of Deribri. Deribri itself is quite small, and the more natural capital is the city of Guinrhyce (which is still in the Deribri hegemony). Guinrhyce has a population of $P_i = 44884$ and $I_i = 700$. For the Deribri kingdom/empire, $P_t = 939729$ and $I_t = 37787$. Assuming that $u$ is a function of $\bar{I}$, the average infrastructure of the hegemony, \[u\left(\bar{I}\right) = 0.96 \left(1-\exp\left(-\tau \bar{I}\right)\right) + 0.04\], where $\tau=0.00039$ is a constant which determines the speed at which the function varies, then $u\left(\bar{I}\right) = u\left(102\right) = 7.8\%$. This yields $P_r = 11108079$. Since the Kingdom of Deribri comprises 367 hexes, we can say that the population density of the entire kingdom is ${P_t + P_i \over 367 \cdot 347} = 94.605$ persons per square mile. This is pretty high. However, we can either 1) chalk it up to magic/it's my world, go kick rocks, 3) accept that the cities are too populous, or 3) increase the required distance between cities according to CPT.

Even if we accept a high density of 95 for the kingdom, there is still a really high local density based on the rural population. ${I_i \over I_t} = 1.852\%$, so Guinrhyce will support about $R_i = {I_i \over I_t} P_t = 206937$ people outside the city walls. This is a total hex density of ${P_i + R_i \over 347} = 706.409$ persons per square mile! Inside a city itself, this may be reasonable. But even leaving off the urban population still gives a density of around 600 pop/sqmi. Much too high.

However, it's still good to work through these things. These tools will be useful to approximate populations once I've reduced the overall city sizes appropriately.

April 4, 2019

Trade IV: Fixing the Seaways

I had a Big Problem with the way the seaways were generated, so I haven't included them in the trade network yet. But this is a shame. So I will fix it.


Mostly, it's good. But occasionally, weird stuff like this happens (the route marked in red). The error happens during the "refueling stops" portion of the code. First, a seaway is found between two cities of appropriate size and infrastructure. These are the anchor points. However, these routes are quite long - I limit it to search within 50 hexes, or around a month at sea. That's not impossible, but for a regular trade route is pretty tough. You want the ability to stop at a friendly port and resupply. So the code will then search along that route for nearby cities. They must have more than 1000 people, but can be much too small to originate a route of their own. So the code will split up the original, long route into manageable chunks.

However, I was getting this weird error where the splitting was rejoining everything back together incorrectly. That should be fixed now, and I can add these into the main trade network. As it is, everything is pretty isolated without access to other continents.


I would also like to determine a "piracy index" based on the frequency of ships passing through a given hex. This is gameable information: stuff that's not just pure numbers for my own enjoyment. Players can make decisions (to pirate, defend, or take the long way) based on this gameable information.

April 1, 2019

Demographics VI: Bring Class into It Again

With racial distributions in hand, I can create a simple system to populate a settlement with NPCs. Keep in mind that this is descriptive, not prescriptive: all I want is a list of the important characters in a place, and what their stats might be, and who their second-in-command is, when the PCs inevitably mouth off to them. I'm well aware that the 5e (or any edition) class system is not well suited to non-adventurers.

I've created an unholy mixture of Alexis's tables from here, here, and here, which provide excellent thought into how a population distribution is created in terms of level, and how base ability stats are inferred from that. The stats are modified based on this and the 5e Basic ruleset.

One thing to keep in mind is that these are not rules for character creation. There might be some overlap (for example, characters cannot decide their age).

Racial Distribution

This is determined in the similar way that a pricing reference amount would be determined for, say, wood or gold. Each settlement gets 1 reference for its base race. These are then distributed along trade routes. Once all this has been done, the total value is normalized so that we have a proper distribution which adds to 100%. Because orcs rarely trade, they are usually the minority, near those orcish cities which are plugged into the network. The deeper into a homogeneous nation you go, the less likely it is to see other races.

Class Distribution

According to this post, there are four types of 5e classes:

Type I - Institution based

Bards must train at a college. Clerics must train at a seminary. Wizards must train at a university. There are no monks in my world. These institutions are placed like any industry and distributed according to the same principles as the rest of the trade network (which is such a useful tool!).

institution infrastructure population
university 534 50000
seminary 534 25000
college 534 12500

Type II - Density based

Barbarians, druids, and rangers will all prefer wilder areas. They won't be totally absent from dense areas, just rare. On the other hand, rogues and thieves have more marks in a dense settlement.

Type III - Random

Paladins, sorcerors, and warlocks all have personal vows or obligations. So their distribution is small and random.

Type IV -Fighters

Everyone else is a fighter. Easy.

Score Determination

Depending on the class, the highest scores are assigned to appropriate abilities (e.g., wizards get the highest score in INT), and the rest are randomly assigned.

Age Distribution

Using the equations from here.

Aging Effects

Disclaimer: these are not character effects. They're just for NPCs for now. First, the age of the person is normalized to human-60. So a dwarf, with a slightly longer maximum lifespan of 125, is equivalent to human-60 when she is $60 \cdot {125\over 80}=93$ years old. Every year after this point, the character must roll 1d20 above their STR, DEX, and CON, or lose a point from each. Similarly, if they roll 1d20 above INT or WIS, they gain a point. CHA is unaffected.

Now then. How does it all shake out?

Drichsze, population 63122, founded in 3117. There is a seminary (possibly named after the town or for the deity it serves) and a bardic college (College of Drichsze) here. The top 25 highest leveled persons are:
  • Hilkamyn, a 30 year old human male, Fighter 11
  • Okorzych, a 55 year old human male, Fighter 11
  • Madwgawn, a 22 year old human male, Fighter 10
  • Czymiet, a 25 year old human male, Rogue 9
  • Noraw, a 31 year old human male, Fighter 8
  • Widdocko, a 45 year old human male, Rogue 8
  • Marryawn, a 25 year old human female, Rogue 8
  • Badow, a 22 year old orc female, Fighter 8
  • Brwych, a 22 year old human female, Fighter 8
  • Myszych, a 30 year old human male, Rogue 7
  • Popachno, a 67 year old human female, Fighter 7
  • Gwieck, a 52 year old human female, Cleric 7
  • Tryzniek, a 25 year old human female, Fighter 7
  • Rinajaal, a 31 year old orc female, Fighter 7
  • Jezhciski, a 53 year old human male, Fighter 7
  • Picarwe, a 56 year old human male, Fighter 7
  • Elodwe, a 28 year old human male, Cleric 7
  • Dwodre, a 47 year old human female, Warlock 7
  • Tegalwy, a 23 year old human female, Rogue 7
  • Dwowynn, a 25 year old human male, Rogue 7
  • Rowtrano, a 63 year old human male, Rogue 7
  • Dyceri, a 70 year old human female, Rogue 7
  • Gwalwymar, a 35 year old human male, Fighter 7
  • Dachafgalas, a 46 year old human male, Fighter 7
  • Krycigone, a 59 year old human female, Fighter 6
Here is the beauty of the system. I don't have to assume anything about these people. Maybe Hilkamen is the ruler of Drichsze, having climbed the ranks through skill or fortune of birth. Perhaps Gwieck's connections through the College of Drichsze have placed her in a high position. Or maybe the criminal gangs run the city, through their leader Widdocko.

The list is dominated by humans, of course, but Badow's militant prowess is nothing to scoff at. What sorts of things has she had to endure as minority, and how has that shaped her?

Dyceri is the oldest here, although with a statblock of 5/8/11/16/15/15, her activities are more limited to teaching new pick-pockets the higher arts of political subterfuge. The oldest person is Llermy, who at 80 years old should have advanced past level 1...

What about the highest for each class?
  • Glerwy, a 21 year old human male, Barbarian 5
  • Caro, a 57 year old human female, Bard 6
  • Gwieck, a 52 year old human female, Cleric 7
  • Emhach, a 31 year old human female, Druid 2
  • Hilkamyn, a 30 year old human male, Fighter 11
  • Zienys, a 24 year old human female, Paladin 5
  • Eniecho, a 55 year old human male, Ranger 6
  • Czymiet, a 25 year old human male, Rogue 9
  • Wocko, a 57 year old human female, Sorcerer 5
  • Afakiro, a 31 year old orc male, Wizard 4
  • Dwodre, a 47 year old human female, Warlock 7
What sorts of things have these people been through? What stories can they tell?

All this shows how a comprehensive framework does not replace imagination, but it provides a coherent structure upon which to base that imagination. Given the facts, we can easily construct a narrative which describes how this city operates, and how it might respond to the influx of a certain cast of party.

March 29, 2019

Cities III: Toponymy

My generated names are too similar and there is no delineation between personal names and place names. What I'd like is a system to assign toponyms that are similar between settlements. This will aid player recognition (ha, who am I kidding) in terms of culture and personal names. Think, for example, the cities of Leningrad or Cardiff share elements with other cities in those countries, based on the toponyms -grad (place) and caer- (fort). Hence, it's unlikely that you would mistake, upon first hearing, that Petrograd and Caernarfon were personal names.

I'd be remiss if I did not mention this excellent series on naming places, over on Here Dragons Abound. This is a constant source of inspiration.

Since I have no database of names in real use, how do I find these toponyms? And how do I ensure they are consistently applied?

I'll start simply, by assuming that the name is terrain independent: no special convention for hills or mountains or valleys (Cwm Rhondda).

It should be fairly short, 4-5 letters.

It could be either a prefix or a post fix. But that'll need to be consistent.

Not every town will have the same version of the toponym. See the example above of Cardiff and Caernarfon. There are a couple of ways to do this (I might implement lenition rules in the future), but I think the easiest thing to do for now is to generate a new toponym that is within a threshold Levenshtein distance from an existing toponym. This'll account for differences in language and culture.

I won't do it by nation/hegemony (which I have yet to implement, coming soon with the political rules), I'll give each city a chance to take on a toponym similar or the same as that of the city which spawned it (I've been calling these "mother cities"). For now, I only track the mother city, but when I break the peace and install war/rebellion rules, the mother city may be in a different hegemony (even now it can be destroyed and no longer exist, but its children live on). This will preserve culture across national boundaries.

So when a city is being assigned a name, it will have a 20% chance of being assigned one of the current toponyms from its mother city's list. There is a 20% chance it will take a similar toponym, and 10% that it will create an entirely new one (which is then added to the mother's list). This will allow a bit of linguistic drift and everything won't be perfectly uniform.

Since the toponyms will be generated from the racial Markov chains, there should be similarities (but not replication) between, e.g., dwarfs and dwarfs, or orcs and orcs. A savvy player could perhaps pay attention to a town's name and discern some of the history and culture of that place.

Of course, in real history, settlement names change all the time for many reasons. But for now I'll keep names static. One thing at a time.

Let's try it out.

Mother city: Iowendawn, population 898, founded 3183 (human)

Toponyms: Umieu-, Teg-, Cos-
  • Uedestkamtowty, population 395, founded 3608
  • Umieuzowenki, population 1964, founded 3550
  • Umieuronwe, population 16079, founded 3178
  • Umieuaenkilbede, population 9566, founded 3275
  • Umieutamtopry, population 1254, founded 3520
  • Umieuprach, population 1503, founded 3601
  • Unostangel, population 1414, founded 3549
  • Umieudesogon, population 12765, founded 3157
  • Ukopach, population 1899, founded 3563
  • Tegcorwe, population 1799, founded 3092
  • Cosmadei, population 3411, founded 3549
  • Tegmorwen, population 229, founded 3405
  • Dustrys, population 333, founded 3602
It's not perfect, but I like it. It does expose a problem in that the names are generally very long, and the addition of a toponym makes it even worse. We want players to be able to say the names, after all (with a minimum of giggling). The answer lies in the Big Phoney package, which uses neural networks to categorize different syllables. It seems to work pretty well, translating the word into ARPABET:

Umieuaenkilbede $\rightarrow$ Y UW2 M UW0 AA1 NG K IH0 L B EH2 D $\rightarrow$ Yoom-yoo-ang-kil-behd $\rightarrow$ /juˌmuɑˈŋkɪlbɛˌd/

Uedestkamtowty $\rightarrow$ Y UW2 D IH0 S T K AE1 M T OW0 T IY0 $\rightarrow$ Yoo-dist-kam-toa-tea $\rightarrow$ /juˌdɪstkæˈmtoʊti/

I can use this to limit the number of syllables a word has, for ease of pronunciation. I have not been able to find an easy converter between ARPABET and IPA but that is not a priority (update: this package works). However, it's not terribly fast, so I may need to explore a less robust method. I could limit the overall word length to something more manageable, and use this to produce pronunciation guides for players.

March 20, 2019

Resources XX: Old Makes Way for the New

Not all resources can be extracted more efficiently or in greater quantities as local population increases.

In particular, raw agricultural resources will be pushed out of the way by the city.

Hence, I need a signal to indicate when a good is inversely proportional to local population (or infrastructure, or population density, etc).

I'll call this "Type A."

Type A goods, so far, are just those which require physical land to function, which is agricultural resources. Of course, we can think of cases where, say, a strip mine grows in area, but since this is only a single type of mine, we'll leave it alone for now.

The Type A goods (in the system so far) are:

commodity
wood
wheat
maize
oats
barley
cassava
rice

Inverting these numbers requires knowing (or guessing) the highest infrastructure. Although the infrastructure can rise quite a bit (the maximum I have so far is 2742), anything higher than 400 represents a fully settled hex. And indeed, there are considerations here that I might explore later: as the amount of available area grows, so does the number of hands necessary to farm that land. So there is inevitably a trade-off in how much you are able to produce.

All of the Type A goods are also Tech-6 (T-6). This means that only a single point of infrastructure is necessary to begin producing them. I think the best system as a first approximation is that of diminishing returns. A T-7 or T-8 hex may have more hands available, but each additional level reduces the efficiency of production. This is an easy way to account for the reduced amount of farmland or harvestable forest. If we consider that the production per person $p$ drops as the infrastructure $I$ increases $1\to400$, we then see that $p$ is related to base production $p_0$ by \[p = {p_0 \over 399}\left(400 - I\right)\]. I'll have to run some more tests and see how this actually works in practice, but I feel it's a reasonable start.

March 19, 2019

Detail II: Fresh Blood

I had begun working on detailed hex maps here.

It gave me no end of trouble. I wanted to be able to generate a single hex at a time, not the whole world, but there were so many continuity issues. So I took a page out of this book and began a different approach. I would lay down the rivers first, and only then would I generate terrain around it.


To generate the river path, I just use a random walk with a probability based on proximity to the goal (the river egress in red). This works out nice. But this is a flat hex. I had talked previously about using IDW to make a smooth interpolation between neighboring hexes, and adding noise. But I also want to ensure that the rivers have a constant downward slope.


Uh, oops. The river runs along a little ridge! Easy to fix. We just add height randomly until the conditions are satisfied that the river hexes are in a valley or trench.


Doing a few at a time and they line up nice! But the central river system isn't the only drainage I want to worry about - and I can use a bit of erosion like I've done for the world map. That's a quick calculation to figure out where everything should go...


Make the rivers display based on drainage-area:


Then erode. I'm not doing the full erosion code, just an average between the source and target hexes:


That looks pretty decent. What about the hex it drains into?


Whoa. Not, uh, what I expected. The river channels are all wrong. It's possible that there's something odd going on when the code tries to reconcile three input rivers. In many places, the river actually flows uphill! Not ideal. The brute force approach for the 2-river case simply is inadequate for a more complicated system. So then, we have $n$ inputs, with defined heights, $n-1$ connections at defined points, and a single exit, and every hex along the line must be lower than all that precede it.

This, by the way, is where my code starts to balloon into a spaghetti mess, as I desperately bug fix, welding on patches here and there. But eventually I get to a place that isn't totally borked. I still need to fix the way the drainage displays, however. Right now it's not continuous. I'll handle that in another post.


I also see effects from the master hex popping up - there is a clear cliff between the two here. This could ideally be avoided (it can be avoided using some other methods) but in this case I may just "relax" the edges towards the ideal (determined by IDW). Specifically, I'll lower the IDW exponent, making the edges smoother. Without the rivers, the effect is immediate.


But adding them causes a disturbance in the force. It turns out that the code for ensuring the valleys will eventually raise all the hexes...with a hard border at the master hex edge. With a little bit of retooling I can set that to start in the middle first, thus making it more likely that the edges will be relatively unadulterated.


Better. Not perfect, yet. But on the right track.


Eh. Great is the enemy of good and I'm tired of making these images tonight.

March 18, 2019

Resources XIX: Stage 0 Materials

Here are the raw resources I've researched so far.

But I have an interesting problem. A lot of these are ores with modern scientific names. That presents an odd immersion-breaker; a dwarf trader would (perhaps) not carry hematite. He'd carry red-iron, or something. However, I don't want to fall into the trap of making up too many names, while balancing that with playability.


For certain minerals, if only a few places produced it, it would make sense to call it after the producing nation or city. A good example is psilomelane, a manganese ore. Only 141 cities produce it. Of these, 10 cities control 50% of the total production: Nabib, Ashdinjem, Cusraq, Lahmanazlib, Rogan, Malia, Siaglen, Silil, Qoloob, and Crewnevanch. All great names to draw from: nabibite, Cusraq iron, qolooban. In an obscure, independent world, those would work great! Psilomelane is, after all, a Greek phrase meaning smooth-black, from the appearance of the stone. So all these things must be taken into account in order to present a consistent and immersive world to player. Having to memorize "qolooban" if you want to supply your blacksmithery is not terribly immersive.

But nonetheless, I will try.

commodity unit tech level occurrence unit/ref ref/acre acre/pop ref/1000 common
wood bd.ft 6 7000000 0.0029 100
goethite lb 7 0.0446 93750 6.311 bog-iron
limonite lb 7 0.0775 93750 157.8557 brown-iron
umber lb 7 0.0194 125000000 9.697
magnetite lb 8 0.0963 93750 0.2524
hematite lb 9 0.1008 93750 0.0101 red-iron
silver oz 8 0.0334 15000 3.8788
wheat lb 6 2500000 0.0001 100
maize lb 6 3528000 0.0001 500
oats lb 6 2500000 0.0007 1
gold oz 6 0.0035 1500 1.7455
barley lb 6 2500000 0.0001 1000
cassava lb 6 52083 0.0011 100
rice lb 6 62500 0.0001 100
chalcopyrite lb 6 0.1699 223404 24.4156 goldstone
azurite lb 7 0.034 47872 113.9394 bluestone
malachite lb 7 0.0777 103723 52.5874 greenstone
clay lb 6 0.0775 937500 157.8557
coal lb 9 0.11 9000000 0.1818
psilomelane lb 7 0.0123 23438 0.9697 bubblestone
pyrolusite lb 7 0.0201 23438 0.9697 blackstone

March 12, 2019

Trade III: You Have Something I Want

Time to put everything together and generate a trade network.

The network graph itself is created from the roads, seaways, and rivers. Right now, I have about 10 thousand separate resource-producing settlements, and about 20 thousand roads connecting them.

The problem I am running into is that networkx is pretty slow with this many edges (about 15,000 nodes and twice as many edges). But I found that pre-processing the trade distances makes this much faster. For instance, two cities may be connected by more than one route, even if its just a road and a navigable river. Although local circumstances may require trade to flow along a non-optimal route (the road is blocked, the river is too choppy), the vast majority of trade will occur in aggregate along the shortest route. Therefore, non-optimal routes are irrelevant to the market network; many of those 30,000 edges will never be used.

The process to assign a resource reference is as follows:
  • From the list of available raw resources for a given city hex, select those which the current infrastructure level will support
  • Determine the reference amount that the city can produce
  • Calculate the gold reference for every hex using the system described here
  • Calculate the reference costs for each raw resource
  • Calculate the labor costs for each raw resource. Really this is more of a measure of the amount of references available, and not the cost directly, but I can define a base cost just like any other material good and get, for example, the daily income of an ironworker
  • Calculate the costs for each manufactured commodity. Because a given good might depend on a number of other manufactured goods, I have to make sure that I do them in the right order. To this end, I define goods in stages. Hematite, as a raw resource, is a Stage 0 good. Iron ore is made from Hematite, and is thus a Stage 1 good. So all Stage 0 goods must be assigned and priced before the Stage 1 goods can be calculated. For every multi-stage good, the overall Stage must be $n+1$ where $n$ is the highest Stage used in the recipe
Manufactured goods are defined through recipes. This takes a lot of guesswork sometimes. For example:
'iron (ore)': {'min1': {'charcoal': 1; 'coal': 2};
'min2': {'goethite': 1.6; 'limonite': 1.8; 'magnetite': 1.4; 'hematite': 1.4};
'labor': 'ironsmith'}
This recipe for general iron ore says that you will need 1 lb of charcoal, or 2 lb of coal (whichever is cheaper), and the cheapest ore between 1.6 lb of goethite, 1.8 lb of limonite, 1.4 lb of magnetite, or 1.4 lb of hematite. These raw materials are then shaped by an ironsmith to produce 1 lb of iron ore.

This system is nicely versatile.

One snag that I've run into is the presence of trade networks without access to any precious metals at all, yet perhaps quite robust industry. There are a few solutions to this.
  1. Remove these networks entirely. No precious metal economy, no economy.
  2. Structure these to work as barter economies
  3. Use another substance as the practical fiat currency
  4. Assign a small amount of gold to the economy to lubricate it
2 and 3 are the most likely, historically speaking. But they also require the most work. The easiest for now is just 1. I think I'll redo a long history once I have a good number of raw resources defined. That should take care of most of these outposts. Most of them are small isolated mountain towns, which makes sense that they might not have structured economies, but there are several large cities in there (around 80k), which starts to make less sense in my mind.

Full trade network (sea routes not yet added), after many attempts to use force-directed layout

March 6, 2019

Resources XVIII: Rebirth

It's time to take a break from history generation to discuss a bit of resource placement. I'd like to see how the models I have currently will perform when applied to a larger area, and then dive into more of the raw materials. These are what I need to create enough of a framework to start running games again - any updates to the system are fine as long as they are to processed materials, not raw resources. Those need to be in place (or at least a minimum working set of them).

To do this, I needed to revisit some of the old numbers and make sure they make sense.

Surprise! Basically none of them do. So I reorganized my workflow.

First, I look around for production numbers for both ancient and modern times. I then compare these to a known quantity, particularly one that I'm holding fixed. I can use pricing ratios to make an educated guess as to the reference amounts and the production numbers, assuming a 500:1 improvement since the Industrial Revolution.

For example, I know that in Roman Britain, silver production was about 200 tons, gold around 9 tons, and copper around 15000 tons. This implies that for equivalent amounts of labor, I can get 75x more copper than silver, and 20x more silver than gold.

Similarly, one region in ancient Greece had a working force of 11,000 and output 200 tons of silver annually. If the ratio of gold to silver prices is about 10 (it fluctuates wildly, of course, but was around 10 in antiquity), and 1 reference of gold is equal to 1500 oz, then a reference of silver is about 15000 oz. Since the ratio of silver to copper is about 20, now I know the reference amounts and production quantities for gold, copper, and silver. Some research yields occurrence amounts, and generally, this research process must differ between categories. Minerals are easy to guess - but agriculture is not. Thankfully, the Romans took good notes about how much material they produced, giving a reference point for how much a technomagically minded society could produce if they put their minds to it.

This is not a terribly academic process, but it's a process, and it's based on numbers, regardless of realism. There are a lot of ways to tackle this problem, but I'll see if this one works for me.

I also need a mechanism for scoping this work. I want to get this into a playable state so I can start running games again, but if I spend years and years researching every possible item on the table, that's foolish. I think I might begin with the equipment lists in the PHB (poorly designed though they are) and develop the items that players might want as basics (with modification, of course). Then, if they want an additional item, it is more or less trivial to add (assuming that the raw materials and industries are already defined).

One thing I am assuming is that magic has little effect on overall production. Of course, this would not be strictly true. Any wizard, for example, smart enough to build traps in his dungeon would be smart enough to put that brain to work building an industrial production facility, putting all the local glassmakers out of business and declaring economic victory over the entire trade network. So there are some sociological questions that arise when considering why magic is not prevalent in the economy. Perhaps it is too rare. Perhaps the magical portion of the population (already a higher slice of the social strata) has bigger things of concern. Lots to think about.

But I'm rambling now, so I'll stop. Plenty to come soon.