
For now, "plague" is intentionally vague. In modern parlance, the term generally refers to the three kinds of disease spread by the Yersinia pestis bacterium: bubonic, septicemic, and pnuemonic plagues. The properties of each are different, so for now I want to think about a general model for plague transmission of infectious diseases. Diseases which may cause epidemics but are not usually transmitted infectiously, such as cholera, are also interesting but can be tackled separately.
Alexis addresses some initial thoughts about a player catching disease (or building up a town's resistance to such) here. As a town's infrastructure rises, the individual's chance for becoming diseased grows, to the tune of $I \ over 10000$. For a settlement of $I = 474$, the chance would then be $0.0474\%$. That's not so bad. In addition, this is just "disease." That's pretty broad. Let's place the chance of contracting actual plague at 0.2%, on top of the chance to contract any disease. That makes the overall chance really low, 0.009%.
Like anything else you might care to learn about, the amount of research done on the subject is staggering. Consider these sources:
- Math behind the Infection
- Modeling plague transmission inMedieval European cities
- The mathematics of disease
Even from just these, a clearer picture emerges of how to model such an event. Particularly, a set of equations (the SIR model), which always interests me. \[{\partial S \over \partial t} = B - {\beta S I \over N} - d S\]\[{\partial I \over \partial t} = {\beta S I \over N} - \gamma I - d I\]\[{\partial R \over \partial t} = \gamma m I - d R\], where $S$ is the susceptible population, $I$ is the infected population, $R$ is the recovered population, $N = S + I + R$ is the total population, $B = 0.4$ is the birth rate, $\beta=0.5$ is the contact rate, $d=0.4$ is the death rate, ${1 \over \gamma} = 26$ is the infectious period, and $m=0.33$ is the mortality. By tweaking these parameters (this particular set is for bubonic plague) we can model different kinds of diseases when we wish.
I don't really care about $B$ and $d$ since these time steps are usually modeled in days and I step history forward one year at a time. So all the calculation will take place in a single fell swoop. \[{\partial S \over \partial t} = -{\beta S I \over N}\]\[{\partial I \over \partial t} = {\beta S I \over N} - \gamma I\]\[{\partial R \over \partial t} = \gamma m I\]. This generates a curve that's quite nice when modeled with the above parameters, for a city that begins with a population of 32,210 and a single infection:
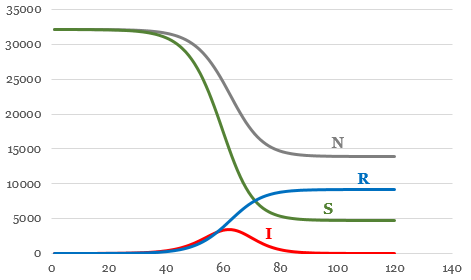
That's pretty devastating.
The plague then spreads to a neighboring city, which must make its own save against infection. And the cycle repeats. A city could shake off the plague but then get it again from a neighbor. This makes a death spiral possible to wipe out an entire civilization.
....Now having done all this work, it occurs to me that the fancy equations are irrelevant. The only way to be removed from the pool entirely is to die...which means that the only calculation necessary is $N_1 = \mu N_0$. Huh. However, the full calculation can still tell me how long the epidemic lasts, in order to spread it to other settlements over more than one year. Plus, it might be interesting to know how many total are infected in case the party is caught in the middle of an epidemic.
Somewhat anticlimatic.
No comments:
Post a Comment