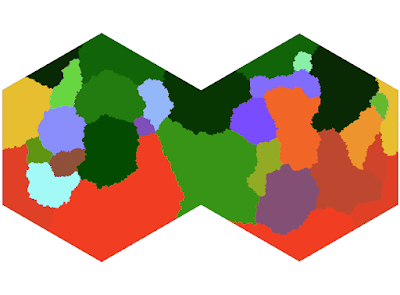
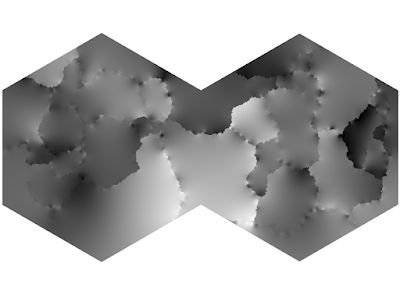
However, I think I can get some mileage out of using plates themselves to generate a better uplift map. The code for this is pretty simple, some general flood-fill algorithms along the fault lines:

In this model, each hex is only affected by the faults it actually borders:

This gives us some smooth transitions and some stark differences - which I feel effectively captures the action of subducting and overlapping plate faults.
In reality, the difference between ocean and land is not a unimodal curve. Earth differs in this regard because it has uniquely defined oceans in the first place.
However, no one is interested in fitting a curve to this specific shape. Until now.
This consists of a piecewise curve as:
\[
h_1(x) = 55 \exp\left(-\frac{x}{0.65}\right)\textrm{ if }x >= 0
\] \[
h_2(x) = 55 \exp\left(\frac{x}{0.15}\right)\textrm{ if }x < 0
\] \[
h_3(x) = 15 \exp\left(-\left(\frac{x + 4.6}{1.5\sqrt{2}}\right)^2\right)\textrm{ if }x < 0
\]
Where the full cumulative distribution is given by \[H(x) = \int_{-11}^x h_1(n) + h_2(n) + h_3(n)\textrm{ d}n\]
This is in units of 1000 km, which is not what I want. However, if I scale both the inputs and outputs to $[0,1]$, I get a non-linear I/O curve similar to a gamma correction.
Doesn't look quite how I wanted it. Lets do a simulation run.
Starting to see some of those shapes: but the distribution is not great. Most of the mountain chains are reasonably distributed except for the big pile in the middle.
I'll continue to work on this. I'm getting closer to what I want.
However, no one is interested in fitting a curve to this specific shape. Until now.
This consists of a piecewise curve as:
\[
h_1(x) = 55 \exp\left(-\frac{x}{0.65}\right)\textrm{ if }x >= 0
\] \[
h_2(x) = 55 \exp\left(\frac{x}{0.15}\right)\textrm{ if }x < 0
\] \[
h_3(x) = 15 \exp\left(-\left(\frac{x + 4.6}{1.5\sqrt{2}}\right)^2\right)\textrm{ if }x < 0
\]
Where the full cumulative distribution is given by \[H(x) = \int_{-11}^x h_1(n) + h_2(n) + h_3(n)\textrm{ d}n\]
This is in units of 1000 km, which is not what I want. However, if I scale both the inputs and outputs to $[0,1]$, I get a non-linear I/O curve similar to a gamma correction.
 |
| Hm. |
Starting to see some of those shapes: but the distribution is not great. Most of the mountain chains are reasonably distributed except for the big pile in the middle.
I'll continue to work on this. I'm getting closer to what I want.


Hmm, still doesn't look quite 'real' to me; I don't see a big difference between this and most fantasy maps. Something is just off about it. Maybe there's just not enough variation.
ReplyDeleteI agree. Doesn't pass the sniff test.
DeleteI'm interested to see where this goes. I made a world generator a couple years ago that just iteratively lowers and raises random halves of the globe a couple thousand times which gets me results like this
ReplyDeletehttp://www.moondogsoftware.com/Screenshot_20200512_131230.png
Just a couple weeks ago I decided to revisit this using a tectonic plate kind of approach too.
It seems that the best generator would combine a method like yours which yields very nice fractal, natural terrains, with tectonics or some other algorithm that would shape that fractal chaos into fractal order. That's what I'm trying to do here.
DeleteYou've inspired me to try something. Instead of purely fractal faulting, I'll first crack the globe into random plates, then I'll follow the nearest seams to the random halves as I apply the fractal method. I think I'll need to make an abnormally high number of plates in order to get a natural-looking effect, but perhaps this will lay just enough order. I'll share my results if you're interested. I'm curious to know how you're thinking about it.
DeleteThat sounds like a plan. I'd love to be kept in the loop. I think a lot of this is trying random, off the wall modifications, tweaking and learning as we go.
DeleteI haven't generated new plates in my current iteration, but if I redo that algorithm I want less straight boundaries. There are a couple places in this post where there's thousands of miles of more or less straight faults. A quick look at Earth's own plate map will quickly disabuse that notion.
Well, I've come back to this again after a couple of months, but I've abandoned the tectonic simulation for now. Instead, I've forced my fractal generator results to conform to the elevation distribution curve you show from NOAA. The beef I still have here is that it doesn't capture the unusual cases well. There are no narrow continental margins, the mountains are lumps instead of ridges, the depths pits instead of trenches. The stuff in the middle is great, but away from the mean it sucks.
DeleteI may let this ride for now and work on something else.
Same. I need a conceptual breakthrough on it which so far is not forthcoming. Taking a break until we figure this out!
DeleteThat is really so goddamned cool and over my head. Build, brother, build.
ReplyDeleteThank you, Alexis. That means a very great deal to me.
DeleteIf you were to try and model the impact such a massive mountain range would have on the rest of the world, in terms of weather and biomes, you'd probably discover some really interesting results.
ReplyDeleteLooking forward to seeing more.
Oh yes... Check out Swirls
DeleteI can figure out exact climate for every hex: Climate
These maps are a bit older, once I get this elevation model cleaned up/to a stopping point I'll reapply all these algorithms and see what happens.